USD Index Price Analysis: DXY faces resistance at 101.80, but downside risks loom beneath 101.00
- US Dollar Index is trading sideways, with EMAs acting as resistance.
- The RSI indicator suggests bearish momentum may be losing steam for the DXY.
- USD buyers reclaiming 102.500 would pave the way to challenge 103.000; otherwise, the DXY could retest YTD lows.
The US Dollar Index (DXY), a gauge that measures the value of six peers against the American Dollar (USD), prints minuscule gains of 0.06% as risk aversion takes hold due to the US banking system turmoil, and also on a dovish rate hike by the Fed on Wednesday. At the time of writing, the DXY exchanges hand at 101.298 after hitting a low of 101.027.
DXY Price Action
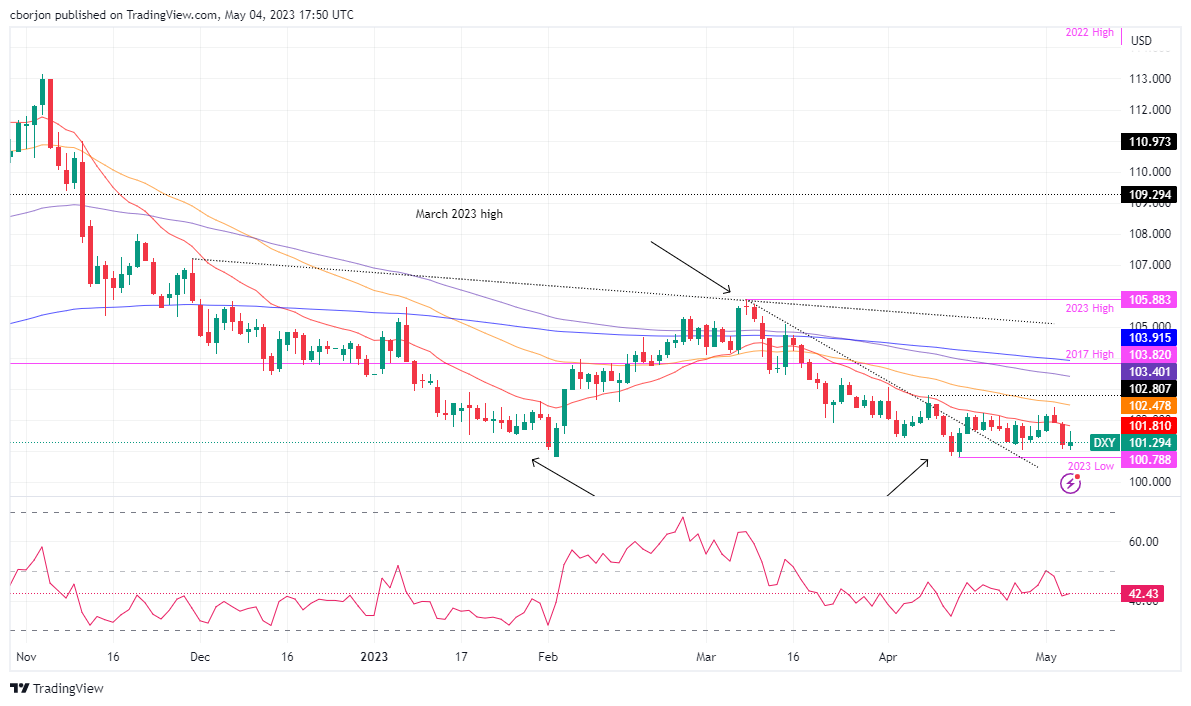
The US Dollar Index continues to be trading sideways after bottoming at around 100.788 in April 14, capped on the upside by the 20 and 50-day Exponential Moving Average (EMA), which are acting as a dynamic resistance, each at 101.808 and 102.477, respectively.
The Relative Strength Index (RSI) indicator stays at bearish territory though it has not reached a lower trough, as price action has done it. So, it suggests that sellers are losing momentum.
If DXY buyers want to shift the bias to neutral, they must reclaim the 20 and 50-day EMAs, meaning that the DXY needs to be above 102.477. Once cleared, the next resistance would be the April 10 daily high at 102.807 before challenging 103.000. The uptrend will extend if buyers crack the 100-day EMA at 103.400.
Conversely, if the DXY drops below the May 4 daily low of 101.027, it would immediately expose the YTD low of 100.788 before challenging the 100.000 mark.
DXY Daily Chart