USD/JPY Technical Analysis: Confined in ranges below 111.20
- USD/JPY continues to consolidate below the bearish trendline.
- USD/JPY bulls want to resume the bull trend but they need to start making higher highs and higer lows.
- Bulls objective is to breakout above 111.02-111.16 area in order to resume to bull trend. On the flip side, bears want to breakout below 110.58 July 26 swing low in order to create a bearish reversal.
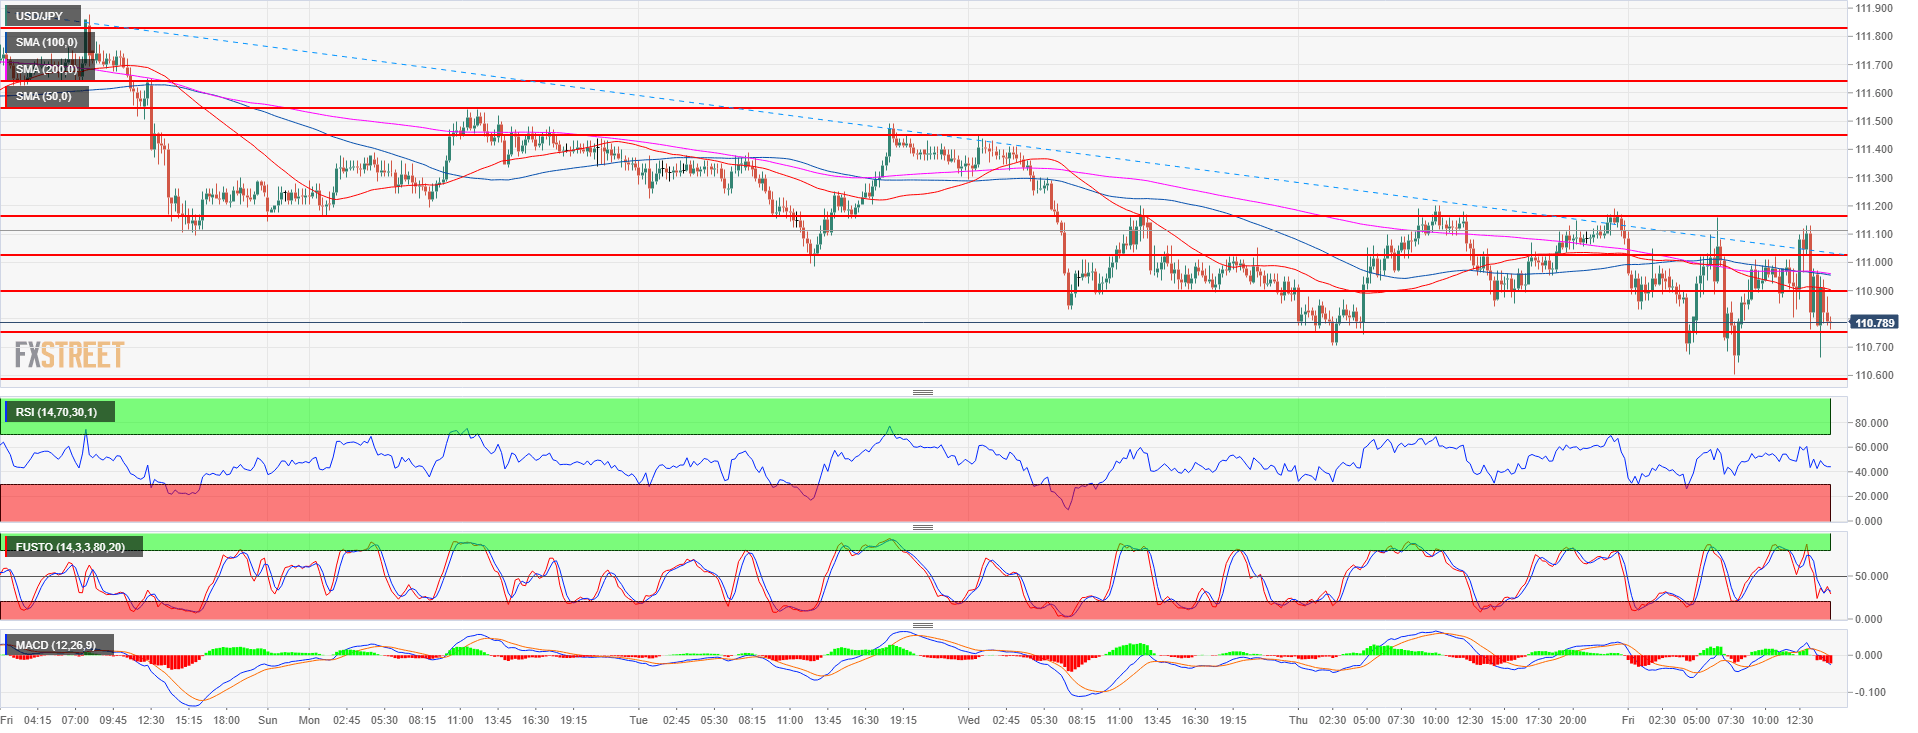
USD/JPY 15-minute chart
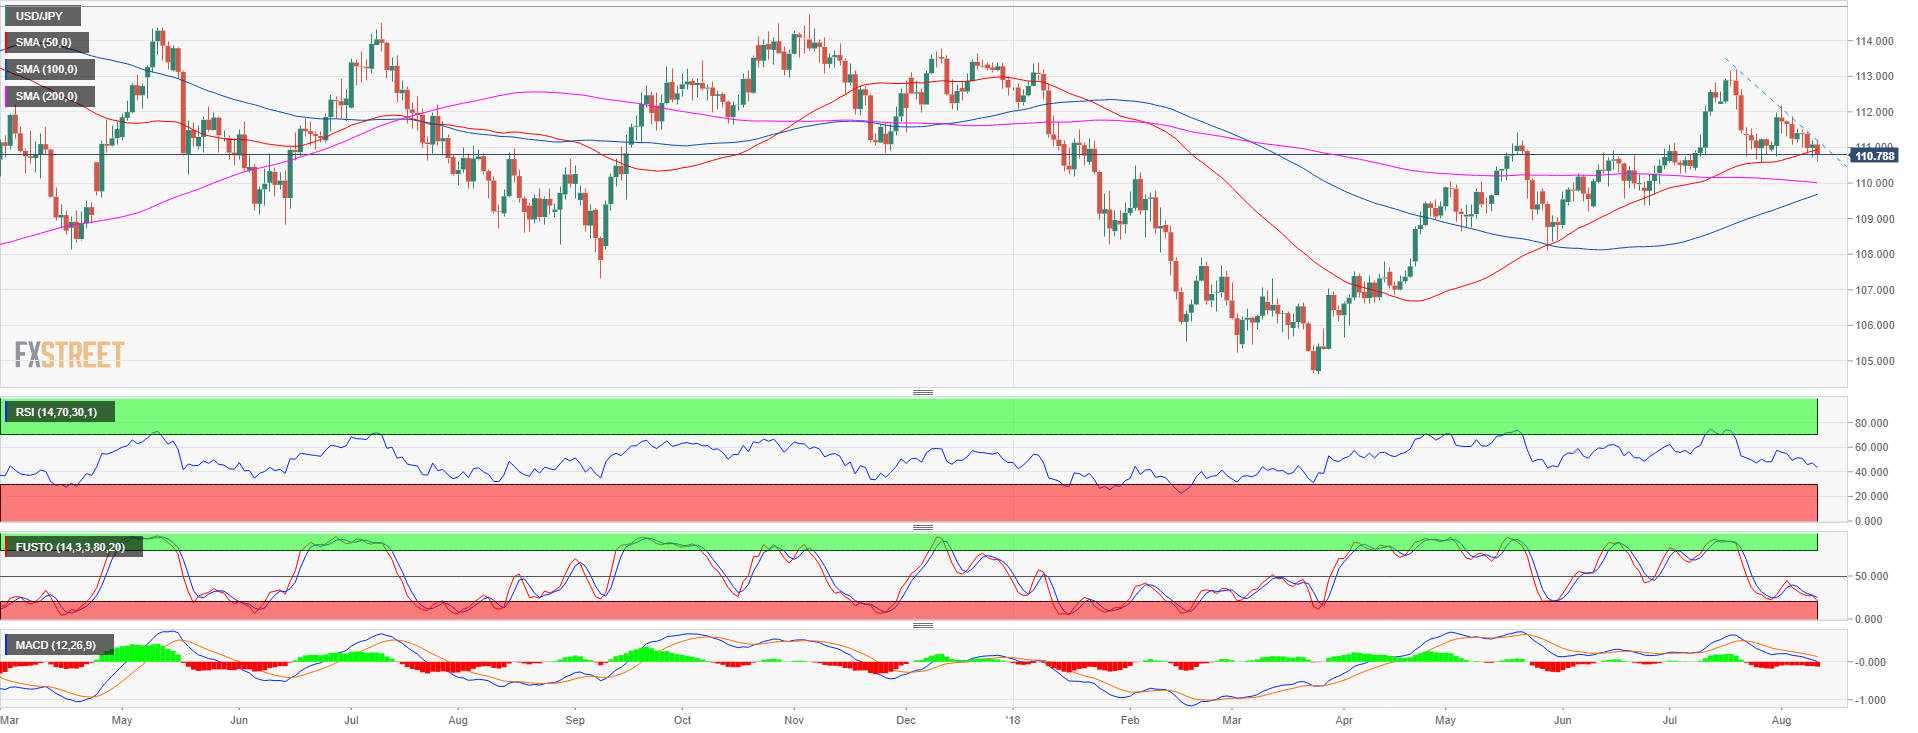
USD/JPY daily chart
Spot rate: 110.74
Relative change: -0.30%
High: 111.19
Low: 110.60
Trend: Bullish / Bearish reversal below 110.58 July 26 swing low
Resistance 1: 110.90 June 15 swing high
Resistance 2: 111.02-111.16 area, figure and current August 6 low
Resistance 3: 111.45 August 8 high
Resistance 4: 111.54-111.64 area, August 6, high and supply/demand level
Resistance 5: 111.82-112.00 area, supply level and figure
Resistance 6: 112.19-112.40 area, July 11 high and intraday swing low
Resistance 7: 112.64 July 12 high
Resistance 8: 113.18, 2018 high
Resistance 9: 113.26-113.38, 200-weekly simple moving average and January 8 high
Resistance 10: 114.45 October 27, 2017 high
Support 1: 110.75, July 23 low
Support 2: 110.58 July 26 swing low
Support 3: 110.27 July 4 low