Back
23 Oct 2018
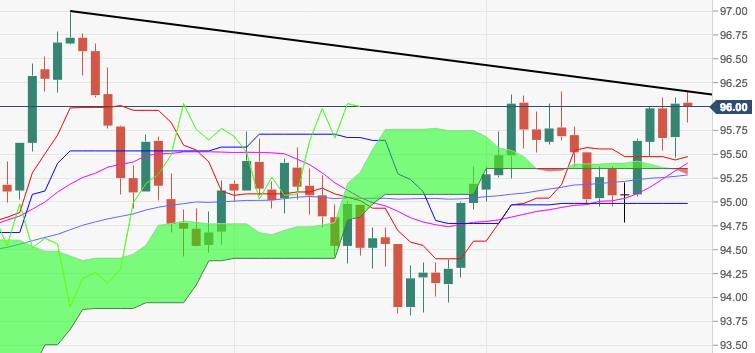
DXY Technical Analysis: The greenback faces formidable resistance just above 96.00
- DXY has once again failed to extend the breakout of the critical 96.00 milestone on sustainable basis today, although it remains lingering over that key level so far.
- The greenback needs to advance beyond the low-96.00s, where coincide recent peaks, a Fibo retracement of the 2017-2018 drop at 96.04 and the short term resistance line, today at 96.16.
- If the up move gathers serious traction, the YTD peak in levels just shy of 97.00 the figure should emerge on the horizon.
DXY daily chart
Dollar Index Spot
Overview:
Last Price: 95.98
Daily change: -5.0 pips
Daily change: -0.0521%
Daily Open: 96.03
Trends:
Daily SMA20: 95.38
Daily SMA50: 95.22
Daily SMA100: 94.95
Daily SMA200: 92.88
Levels:
Daily High: 96.09
Daily Low: 95.47
Weekly High: 96.09
Weekly Low: 94.79
Monthly High: 95.74
Monthly Low: 93.81
Daily Fibonacci 38.2%: 95.85
Daily Fibonacci 61.8%: 95.71
Daily Pivot Point S1: 95.64
Daily Pivot Point S2: 95.24
Daily Pivot Point S3: 95.02
Daily Pivot Point R1: 96.26
Daily Pivot Point R2: 96.48
Daily Pivot Point R3: 96.88