GBP/USD Technical Analysis: Recent upmoves to remain capped by descending channel
- Intraday action on GBP/USD continues to drift towards the middle as the pair remains constrained within recent highs and lows.
- Tuesday's peak-and-drop saw the pair fail to mark in territory north of the key 1.2700 handle, leaving the pair exposed to further downside.
GBP/USD, 5-Minute
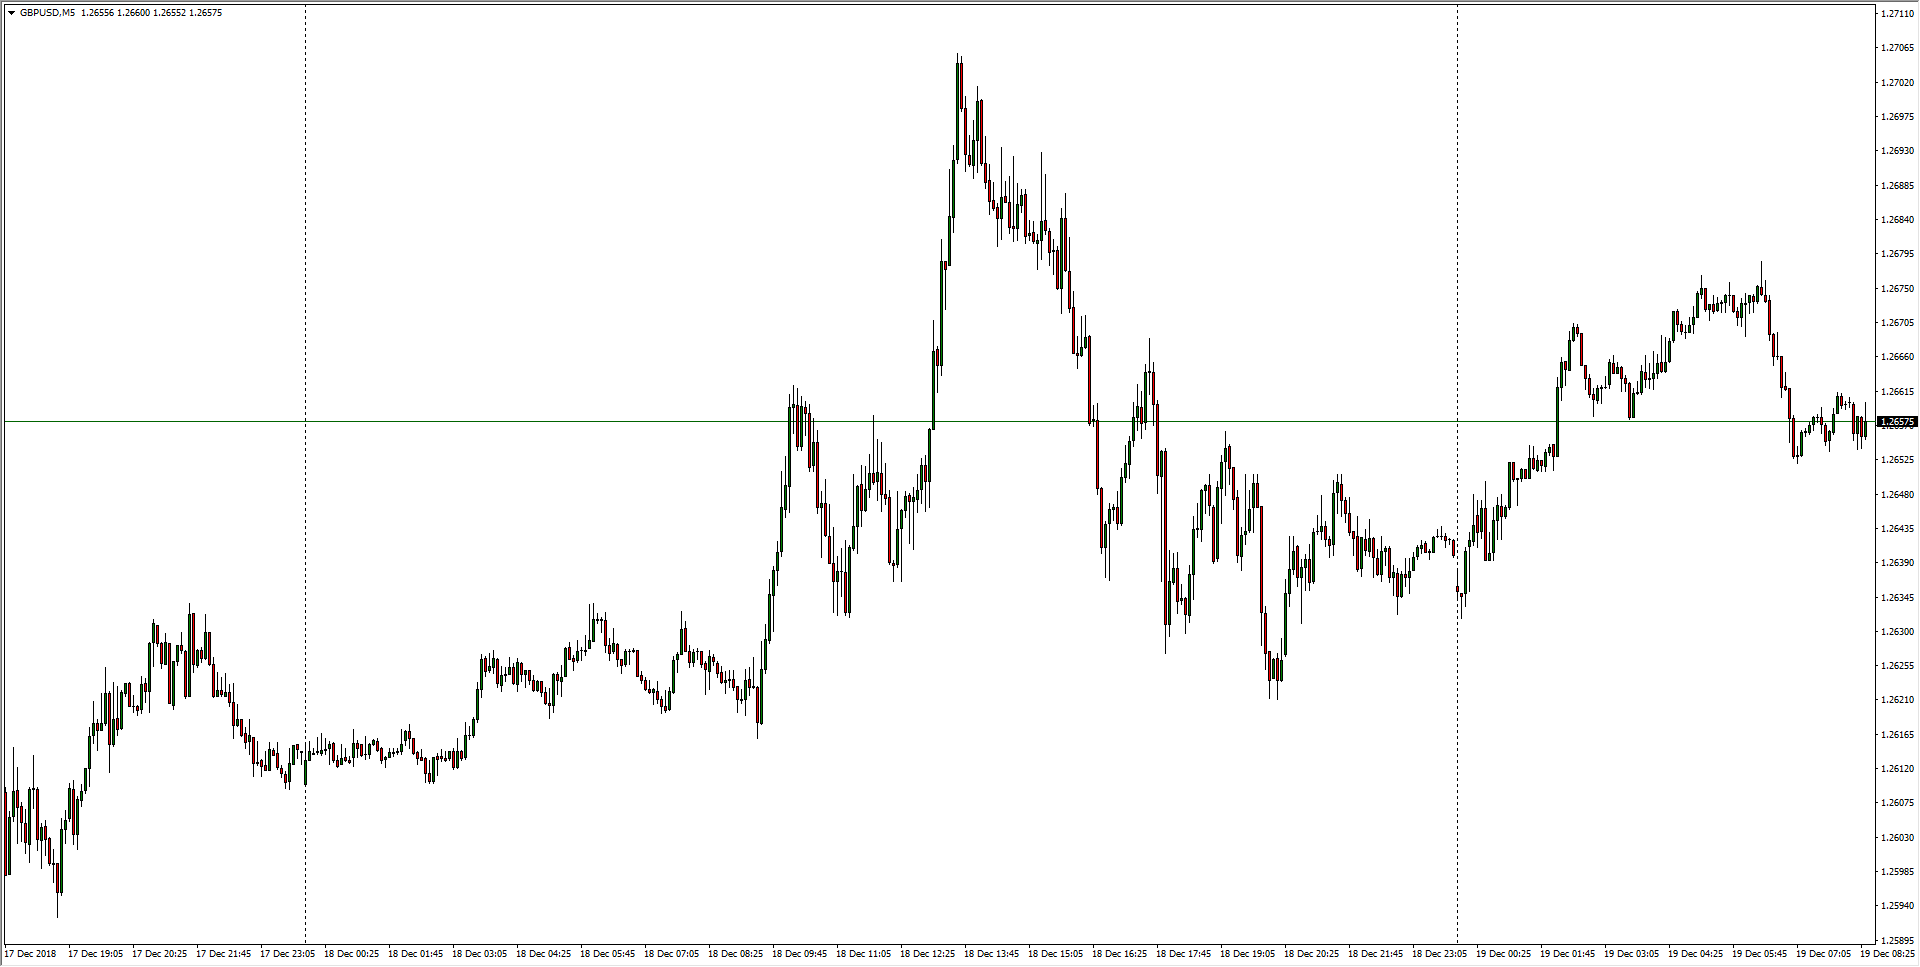
- The Cable is seeing higher lows as the US Dollar drifts across the board, but GBP bidders have been unable to push the pair over key resistance.
GBP/USD, 30-Minute
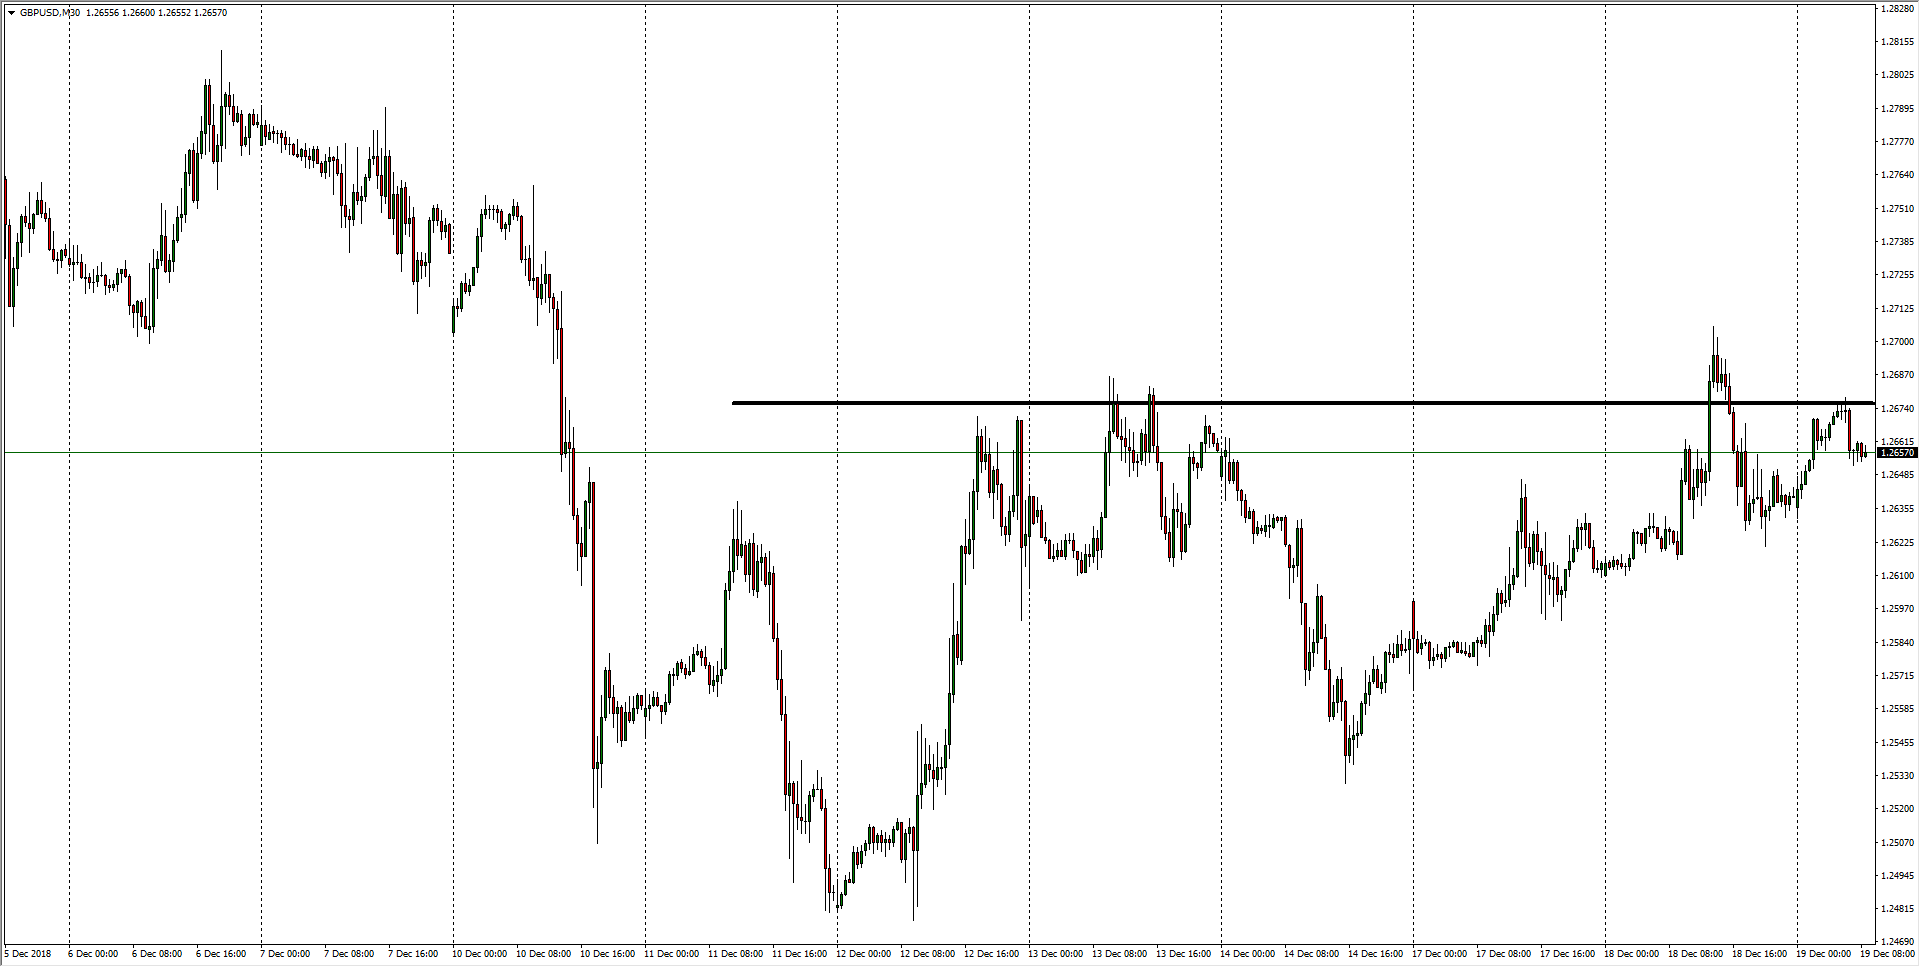
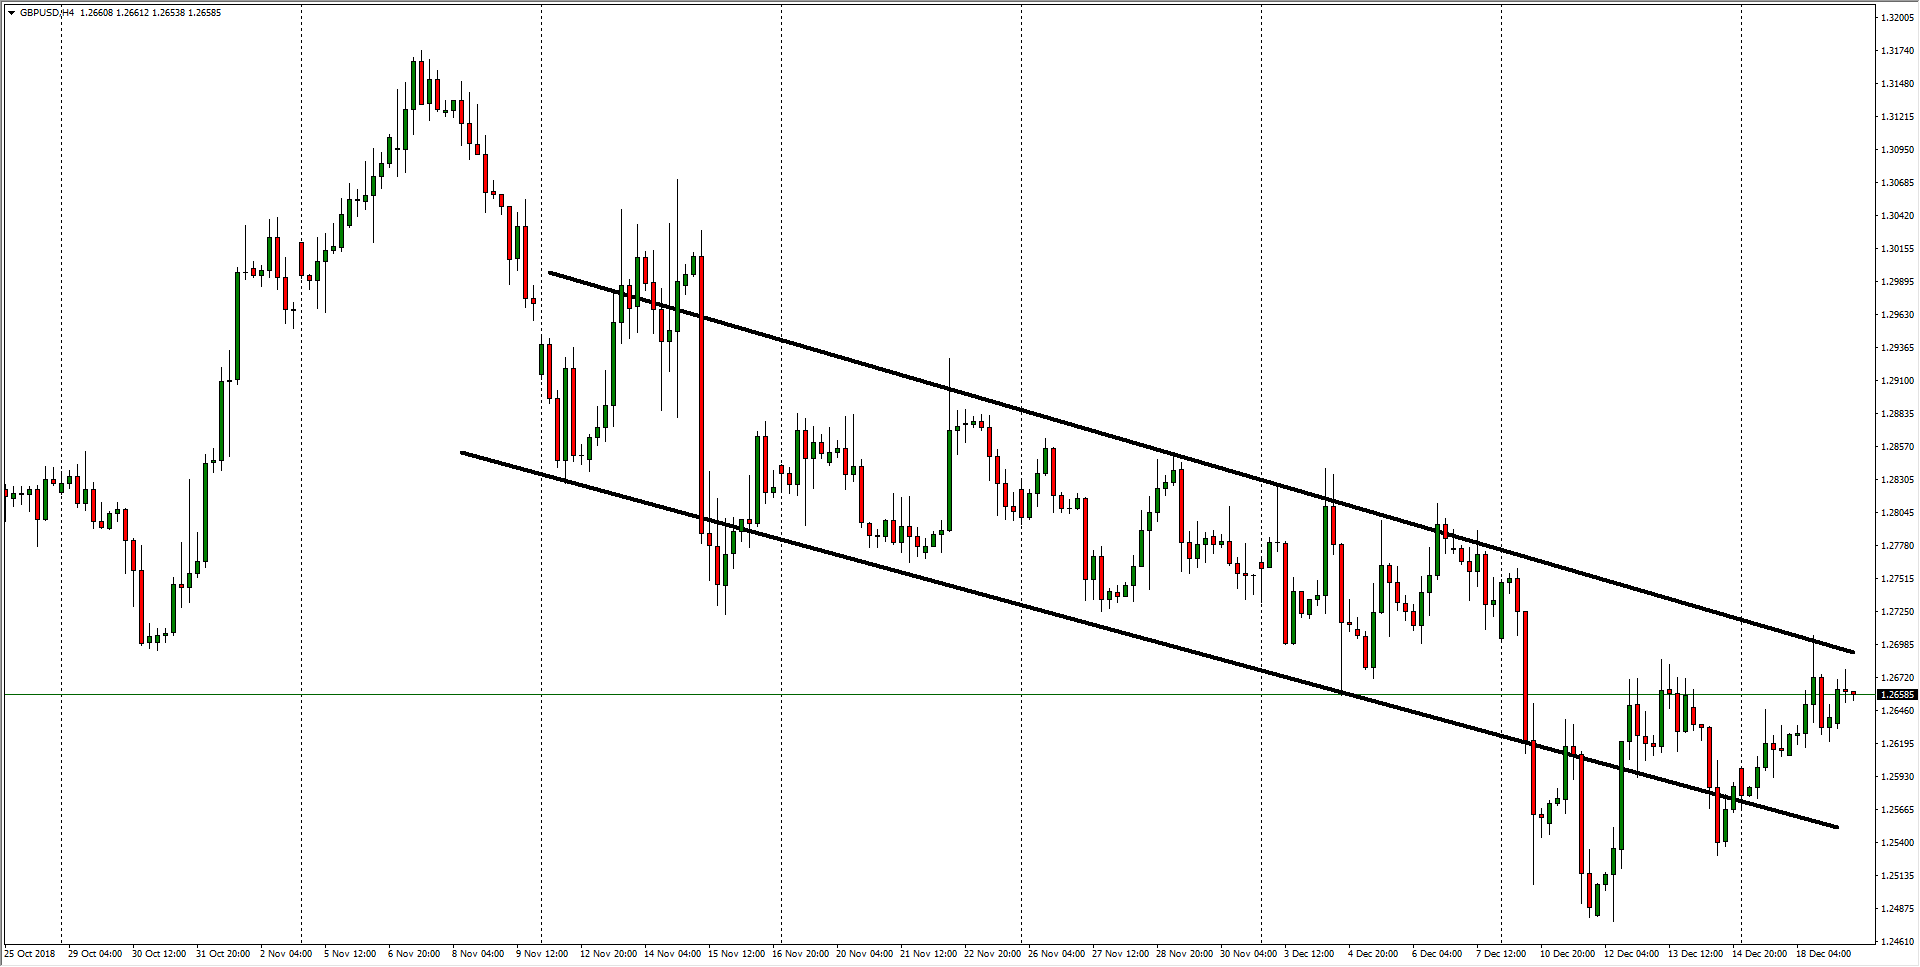
- 4-hour candlesticks show GBP/USD 'falling up' back into a descending channel from last week's bottom near 1.2450, but key resistance has the pair remaining restricted by the upper bound of the Cable's descending trendline.
GBP/USD, 4-Hour
GBP/USD
Overview:
Today Last Price: 1.2656
Today Daily change: 19 pips
Today Daily change %: 0.150%
Today Daily Open: 1.2637
Trends:
Previous Daily SMA20: 1.2714
Previous Daily SMA50: 1.287
Previous Daily SMA100: 1.2921
Previous Daily SMA200: 1.3244
Levels:
Previous Daily High: 1.2706
Previous Daily Low: 1.2608
Previous Weekly High: 1.276
Previous Weekly Low: 1.2477
Previous Monthly High: 1.3176
Previous Monthly Low: 1.2723
Previous Daily Fibonacci 38.2%: 1.2669
Previous Daily Fibonacci 61.8%: 1.2646
Previous Daily Pivot Point S1: 1.2594
Previous Daily Pivot Point S2: 1.2552
Previous Daily Pivot Point S3: 1.2496
Previous Daily Pivot Point R1: 1.2693
Previous Daily Pivot Point R2: 1.2749
Previous Daily Pivot Point R3: 1.2791