GBP/USD Technical Analysis: Cable hugs 1.2850 as Brexit uncertainties unfold
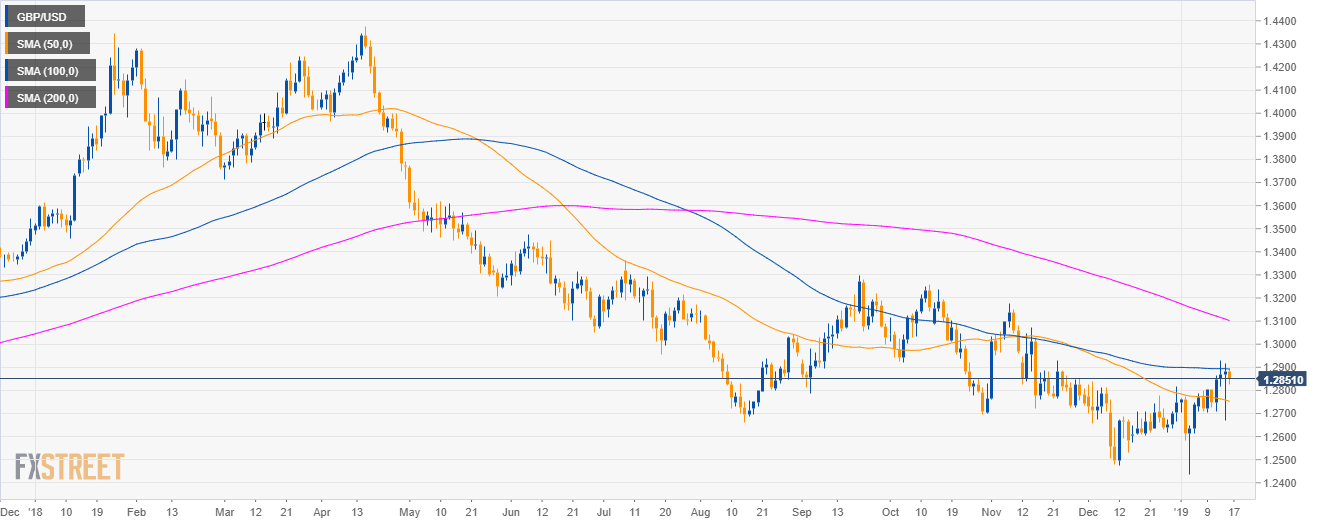
GBP/USD Daily chart
- GBP/USD is trading in a bear trend below the 100 and 200 simple moving averages (SMAs).
- At 19.00 GMT, traders must be cautious as Conservative Party lawmakers will vote for or against PM Theresa May amid growing discontent on the Brexit deal.
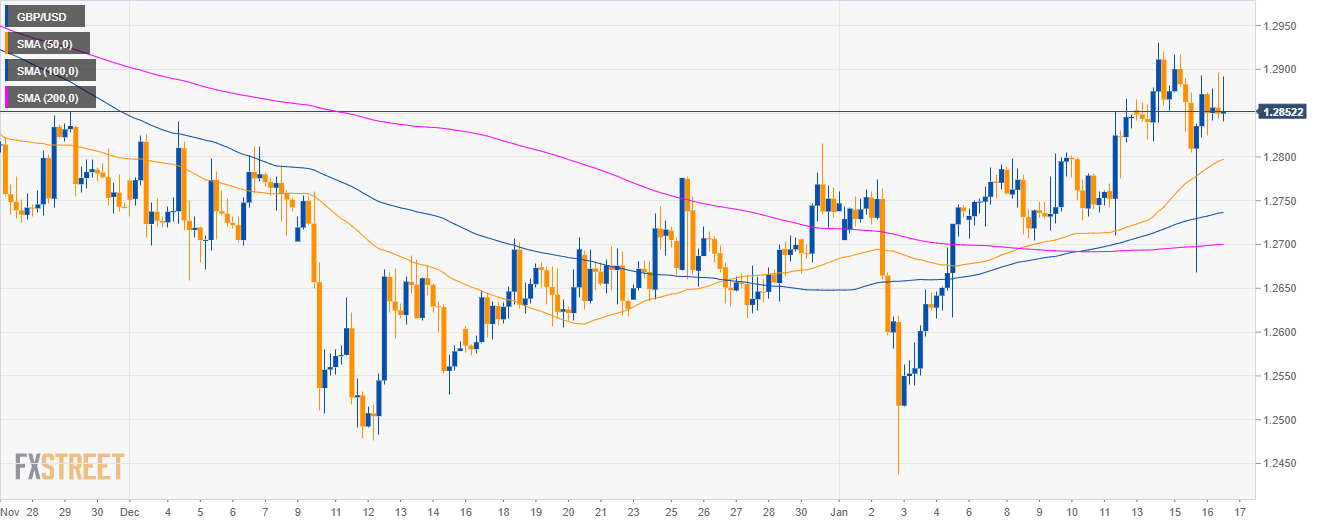
GBP/USD 4-four chart
- GBP/USD is trading above its main SMAs.
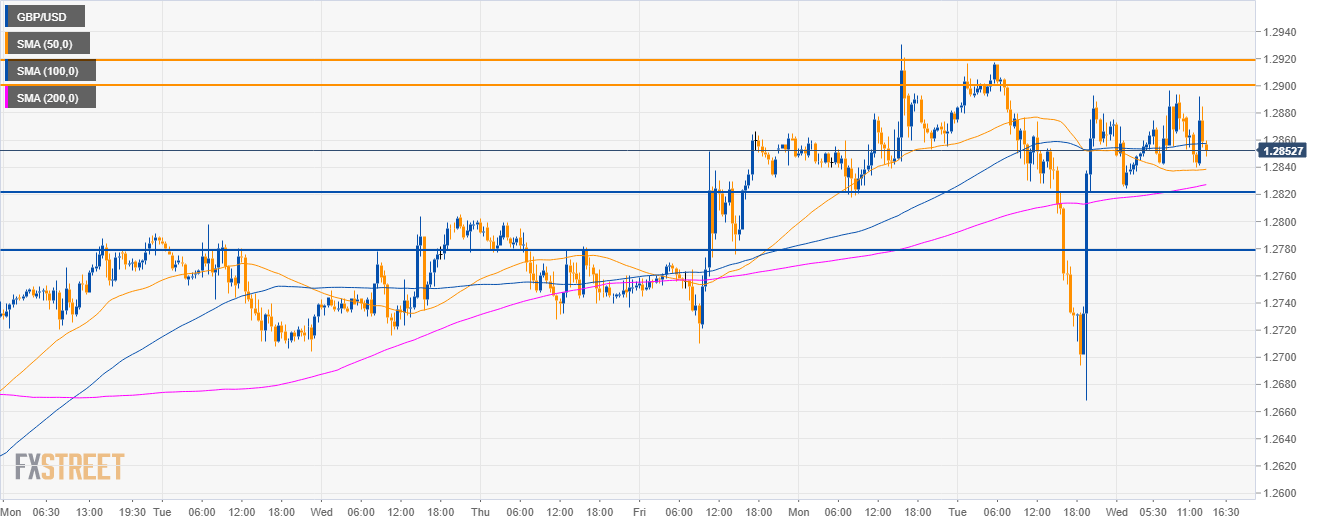
GBP/USD 30-minute chart
- GBP/USD is trading sideways with no clear direction.
- Bears have a small advantage with 1.2820 and 1.2780 as potential targets, but Brexit-related news will keep the GBP very volatile.
Additional key levels
GBP/USD
Overview:
Today Last Price: 1.2852
Today Daily change: -32 pips
Today Daily change %: -0.248%
Today Daily Open: 1.2884
Trends:
Previous Daily SMA20: 1.2721
Previous Daily SMA50: 1.2759
Previous Daily SMA100: 1.2894
Previous Daily SMA200: 1.3112
Levels:
Previous Daily High: 1.2917
Previous Daily Low: 1.2668
Previous Weekly High: 1.2866
Previous Weekly Low: 1.2704
Previous Monthly High: 1.284
Previous Monthly Low: 1.2477
Previous Daily Fibonacci 38.2%: 1.2822
Previous Daily Fibonacci 61.8%: 1.2763
Previous Daily Pivot Point S1: 1.2729
Previous Daily Pivot Point S2: 1.2574
Previous Daily Pivot Point S3: 1.248
Previous Daily Pivot Point R1: 1.2978
Previous Daily Pivot Point R2: 1.3072
Previous Daily Pivot Point R3: 1.3227