Back
29 Mar 2019
AUD/USD Technical Analysis: Aussie at daily highs near 0.7100 figure
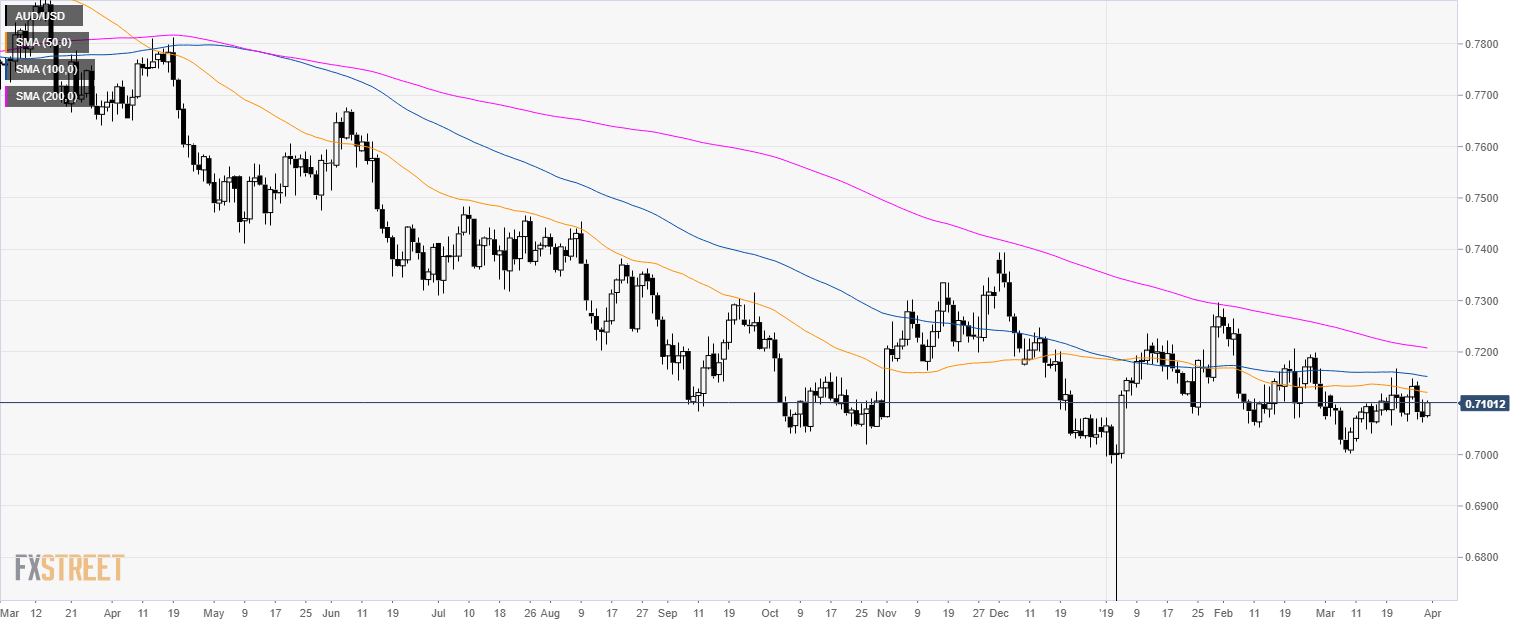
AUD/USD daily chart
- AUD/USD is trading in a bear trend below its main simple moving averages (SMAs).
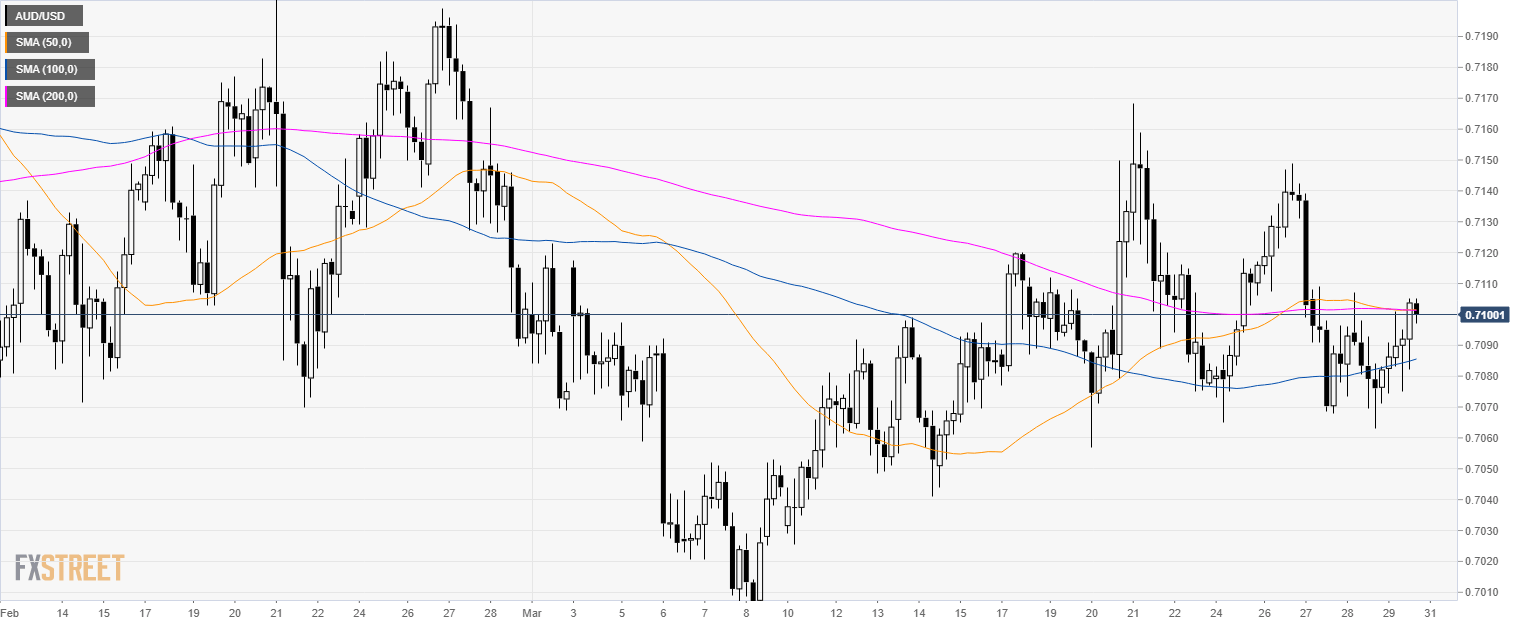
AUD/USD 4-hour chart
- AUD/USD is trading near its 200 SMA suggesting a neutral bias in the medium-term.
AUD/USD 30-minute chart
- AUD/USD is trading above its 50 and 100 SMA suggesting a bullish bias in the short-term.
- 0.7105 is the level to beat for Aussie bulls. A break above it can see a move up to 0.7120 and 0.7135 level.
- Supports are seen at 0.7090 and 0.7070 level.

Additional key levels