Back
8 Apr 2019
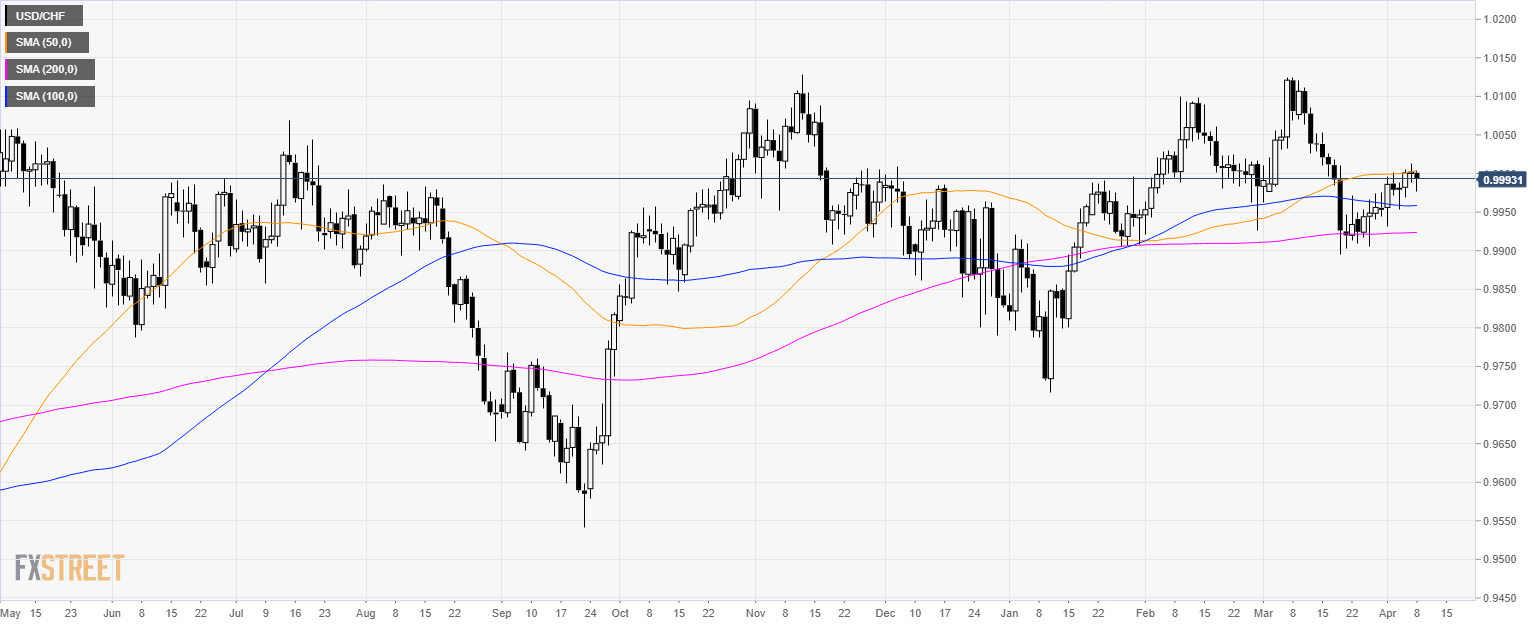
USD/CHF Technical Analysis: Head-and-Shoulders can send Greenback down against Swiss Franc
USD/CHF daily chart
- USD/CHF is currently capped by the 50 SMA near the parity level.
USD/CHF 4-hour chart
- USD/CHF is capped by the 200 SMA.

USD/CHF 30-minute chart
- The head-and-shoulders pattern below the 1.0005 resistance can potentially send the market down.
- Bears can expect support near 0.9975, 0.9950 and 0.9935 level.
- On the way up, resistance is at 1.0005 (strong), 1.0020 and 1.0035 level.

Additional key levels