Back


6 Aug 2019
USD/JPY technical analysis: Greenback trades above the 106.00 figure as market mood improves slightly
- The risk-off sentiment is easing slightly, helping the USD/JPY recovering from monthly lows.
- The level to beat for bears are seen at 105.85, 105.65 and 105.30 support.
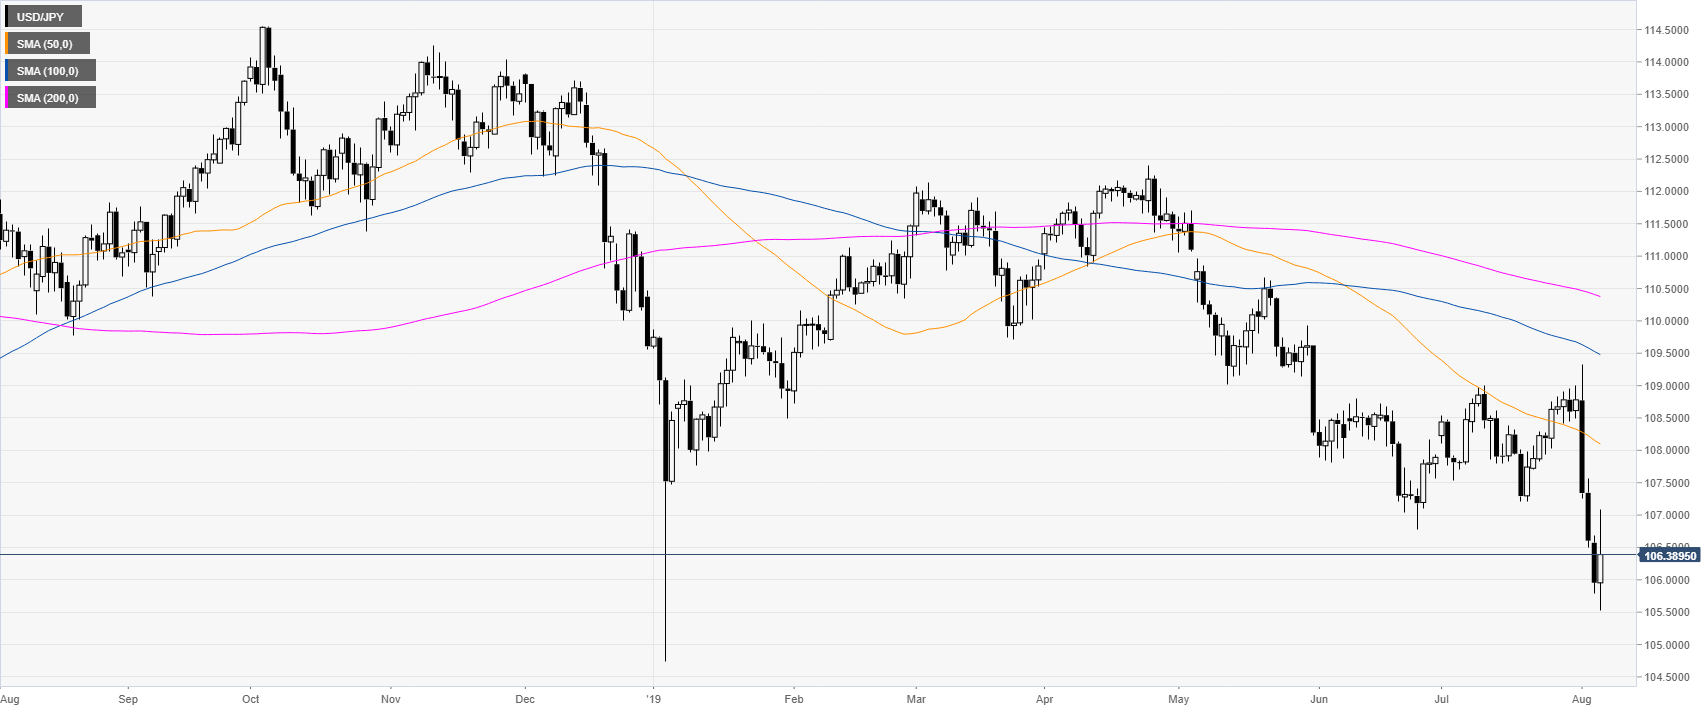
USD/JPY daily chart
USD/JPY is trading off multi-month lows while below its main daily simple moving averages (DSMAs). As the market mood is slightly improving the demand for the Japanese Yen decreased, helping USD/JPY to recover.
USD/JPY 4-hour chart
USD/JPY is consolidating the early August slide while trading below its main SMAs. Bears would need to retake the 106.13-25 support to resume the downtrend. Further down lie 105.85, 105.65 and 105.30 support, according to the Technical Confluences Indicator.
USD/JPY 30-minute chart
The market is trading above the 50 and 100 SMAs, suggesting a correction up in the short term. Bulls would need to break 106.48 to travel north towards 106.91 and 107.20, according to the Technical Confluences Indicator.
Additional key levels