Back
29 Aug 2019
EUR/USD technical analysis: Euro rolling into the Asian session near the 1.1080 level
- EUR/USD is ending Wednesday near the weekly lows.
- The level to beat for sellers is the 1.1080 support followed by the 1.1062 level.
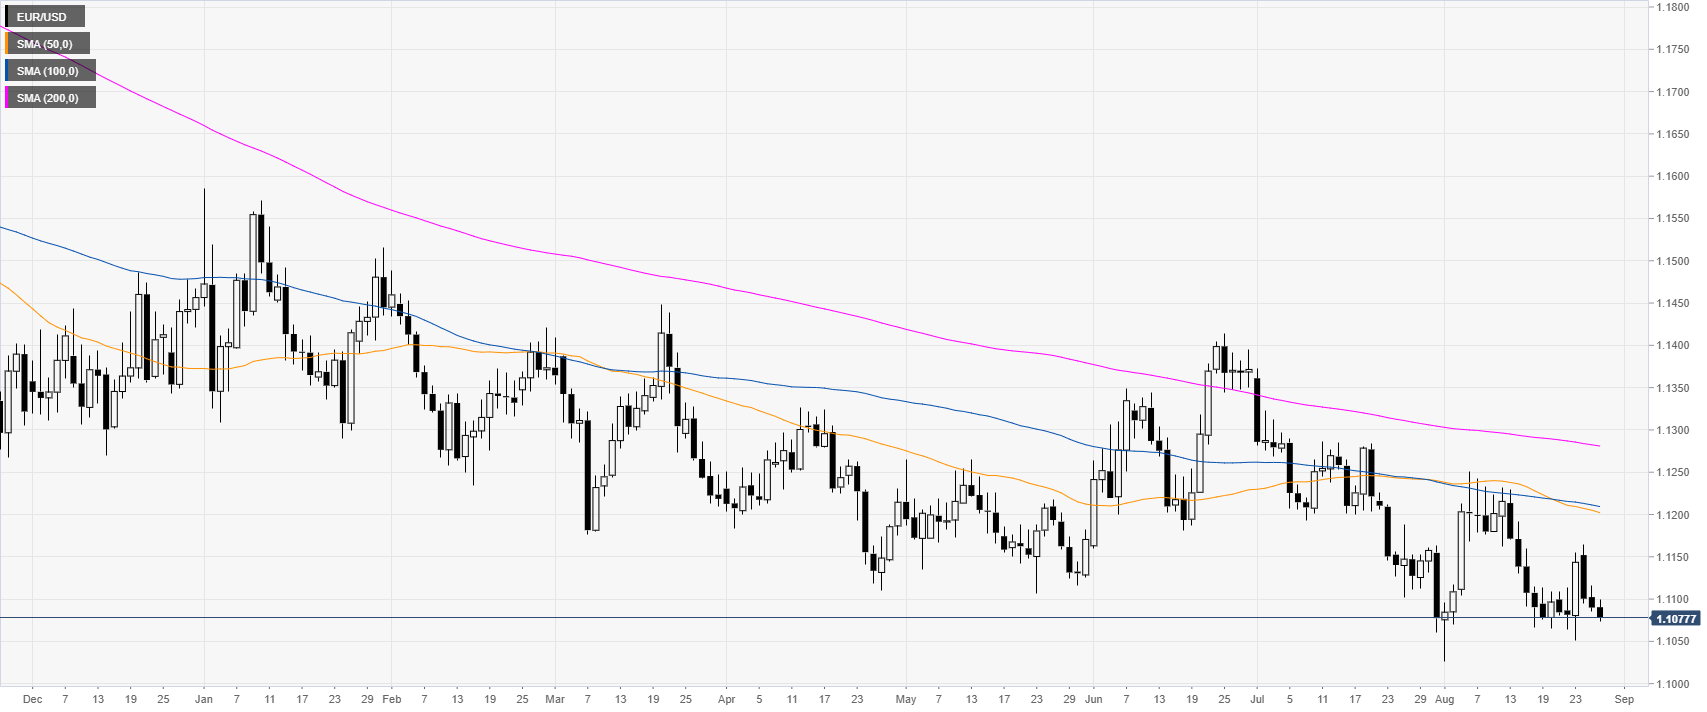
EUR/USD daily chart
On the daily time-frame, the single currency is trading in a bear trend below its daily simple moving averages (DSMAs). The market is down for the third day in a row.
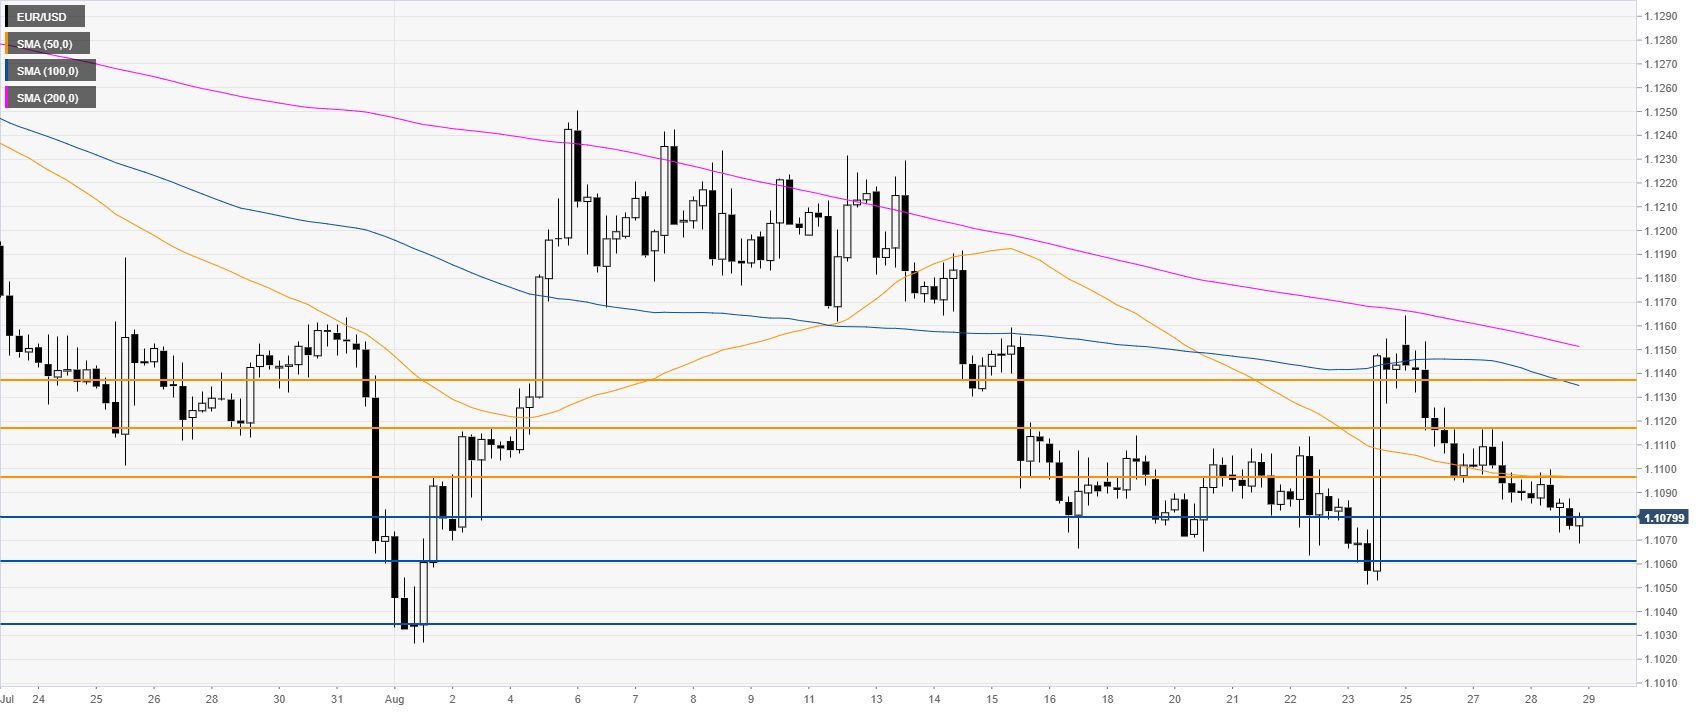
EUR/USD 4-hour chart
The Fiber is slowly drifting lower below the main SMAs. Bears have a daily close below the 1.1080 support which is seen as bearish and opens the prospects for a move down towards 1.1062 and 1.1033 levels, according to the Technical Confluences Indicator.
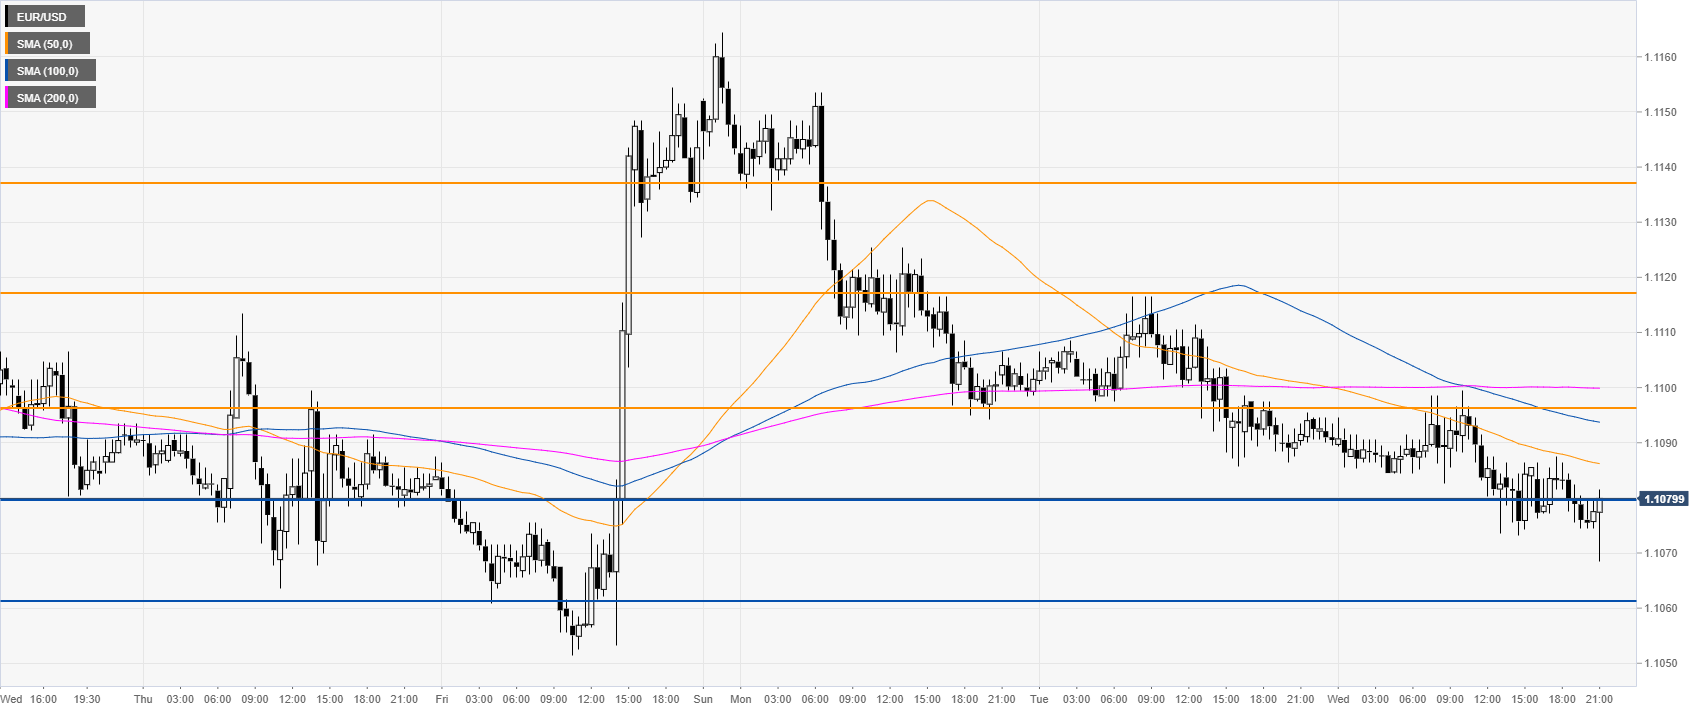
EUR/USD 30-minute chart
EUR/USD is trading below the main SMAs, suggesting a bearish momentum in the near term. Immediate resistance is seen at 1.1080, 1.1098 and 1.1117 levels, according to the Technical Confluences Indicator.
Additional key levels