Back
22 Oct 2019
US Dollar Index technical analysis: DXY emerges from the ashes, trading above 97.20 support
- The US Dollar Index (DXY) is stabilizing above the 97.20 support level.
- The recovery would gain credibility on a daily close above 97.60 resistance.
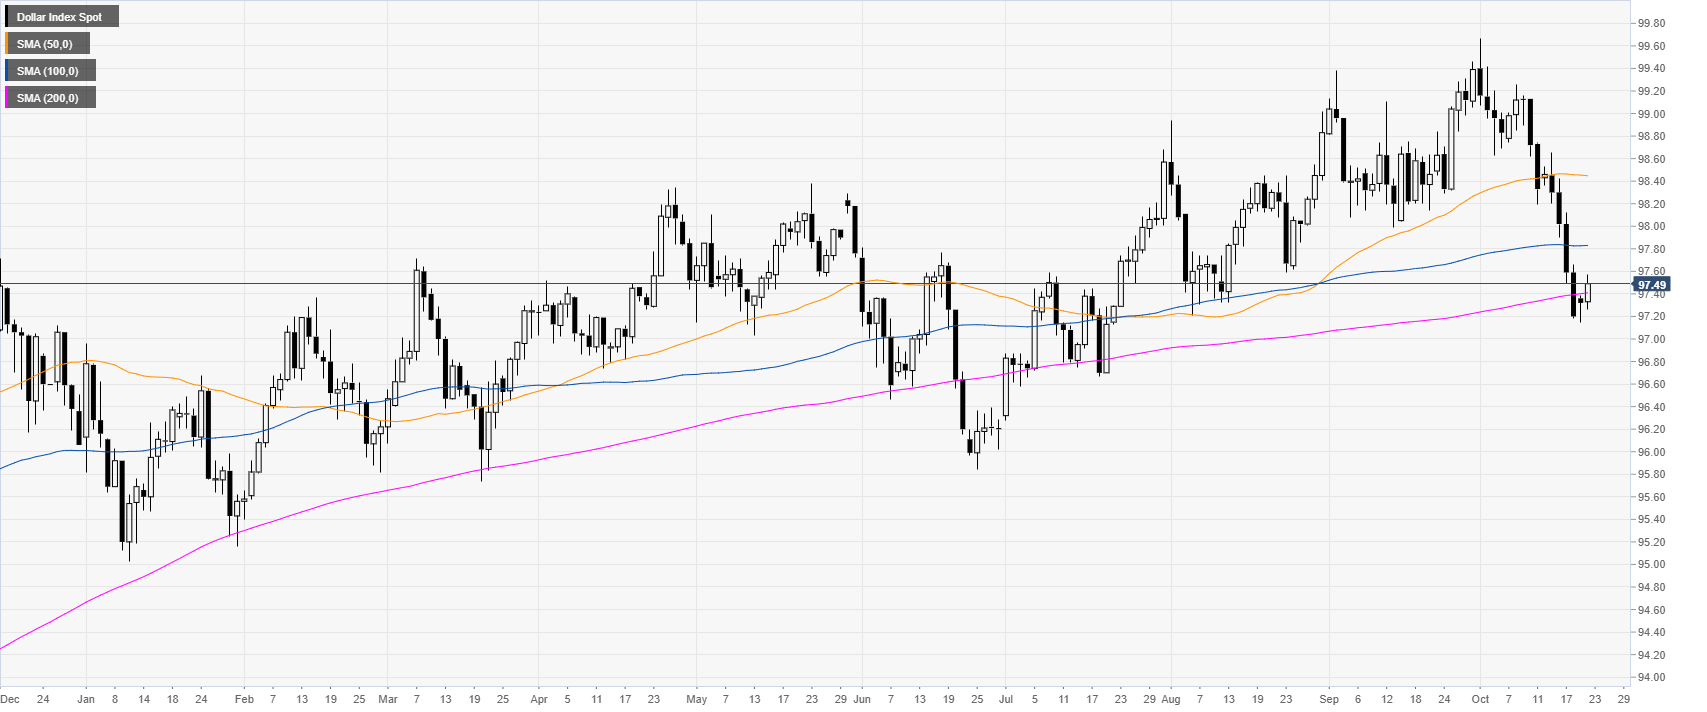
DXY daily chart
The US Dollar Index (DXY) is trading near the 200-day simple moving average (DMA). The market is stabilizing somewhat but further strength is needed to confirm a potential recovery in the buck.
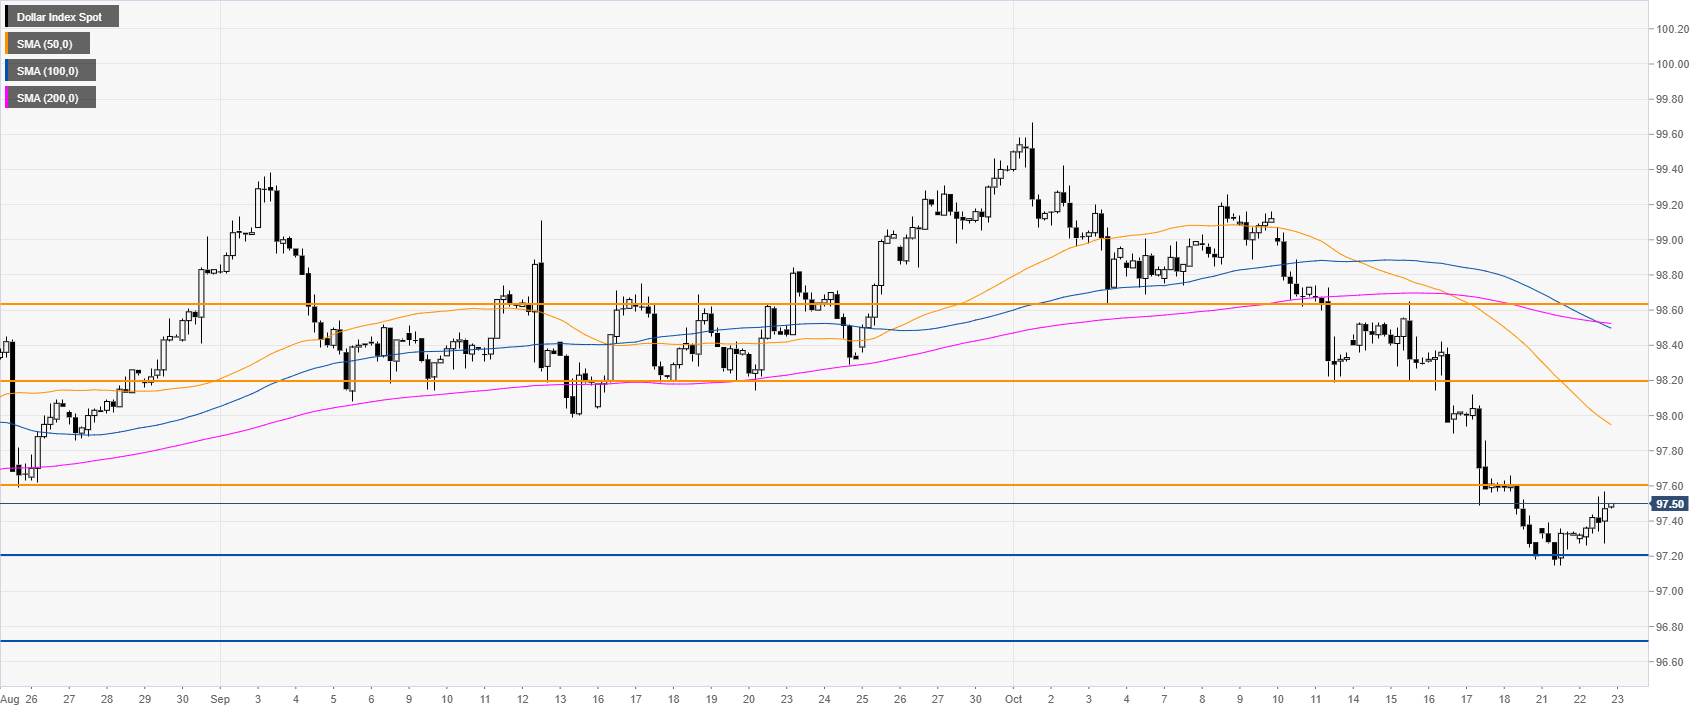
DXY four-hour chart
DXY is trading below its main SMAs, suggesting bearish momentum in the medium term. However, the market is trying to find some footing near the 97.20 support.
A daily close below this level can lead to the 96.72 level.
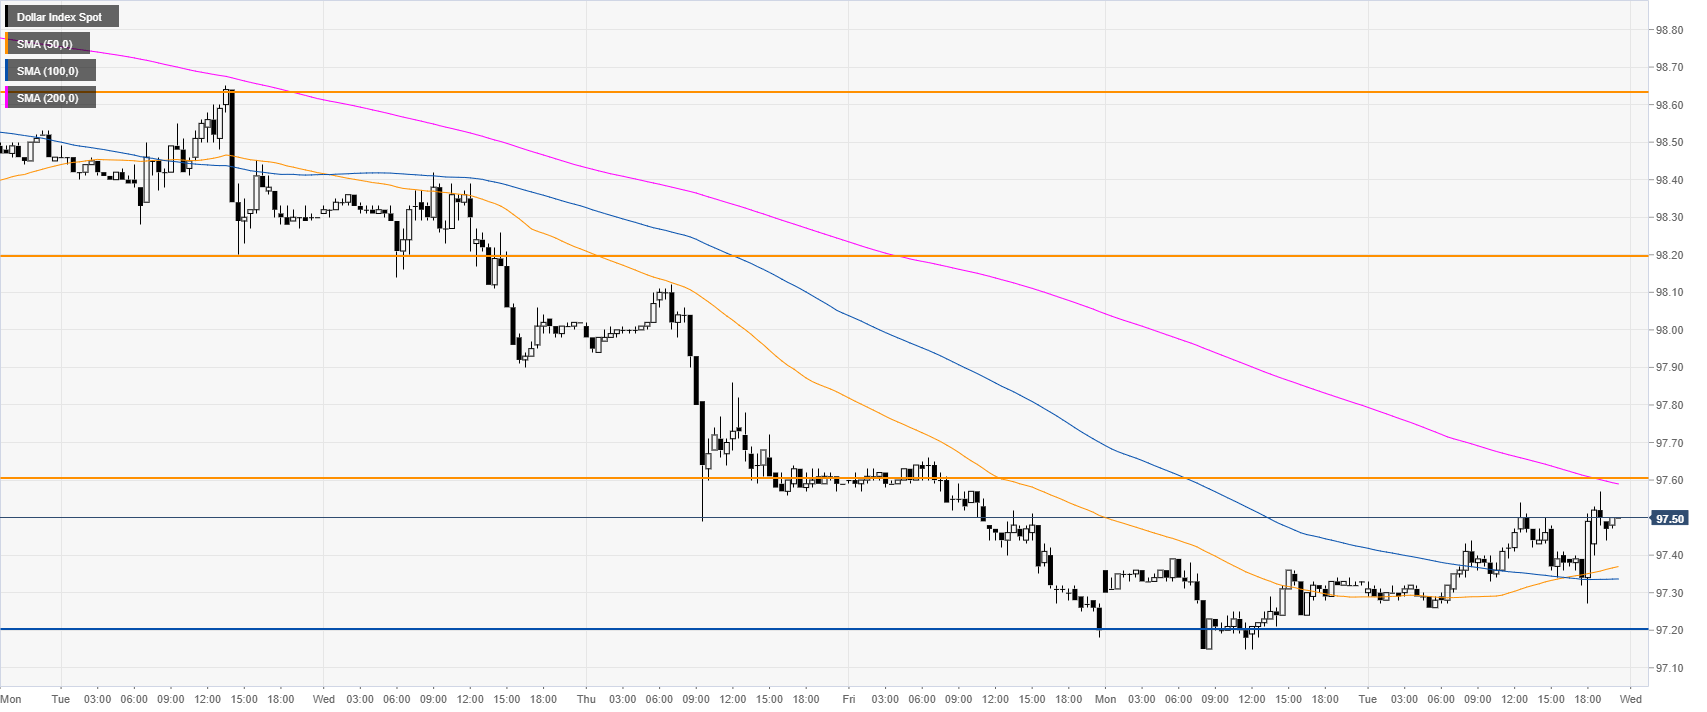
DXY 30-minute chart
DXY is trading above its 50 and 100 SMAs, suggesting a correction in the short term. The bearish pressure would likely diminish further if the market surpasses the 97.60 resistance on a daily basis. Further up lie the 98.20 resistance.
Additional key levels