Gold Technical Analysis: Buyers look for confirmation of immediate falling wedge
- Gold prices pull back from 23.6% Fibonacci retracement.
- 200-bar SMA, 50% Fibonacci retracement will lure buyers following the confirmation of the bullish chart pattern.
- The monthly bottom holds the key to further downside towards June high.
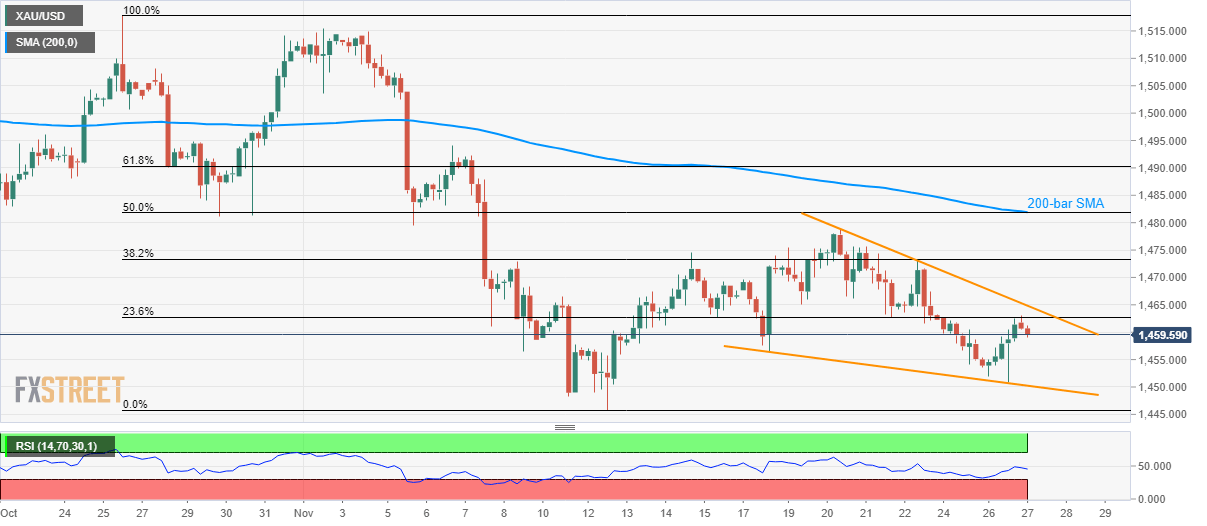
The latest pullback from 23.6% Fibonacci retracement of late-October to early-November fall drags Gold prices downward to $1,459.70 during early Wednesday.
With this, the metal’s another drop to November 12 top near $1,457 becomes imminent. Though, monthly low surrounding $1,445 will restrict the bullion’s further declines.
In the case where the quote declines below $1,445, June month top close to $1,439 will be up for grabs by sellers.
Alternatively, resistance line of one-week-old falling wedge bullish formation, near $1,465, will be the key to watch as a break of which can trigger short-term recovery targeting 200-bar Simple Moving Average (SMA) and 50% Fibonacci retracement, around $1,482.
Given the bull’s dominance past-$1,482, November 06 top of $1,494 will become their favorite.
Gold 4-hour chart
Trend: Bearish