AUD/JPY Technical Analysis: Nears 50% Fibonacci, inside broad rising wedge
- AUD/JPY holds on to recovery gains below near-term key resistance.
- 10-DMA offers immediate support inside a bearish chart pattern.
- 61.8% Fibonacci retracement, formation’s resistance line together becomes the key resistance.
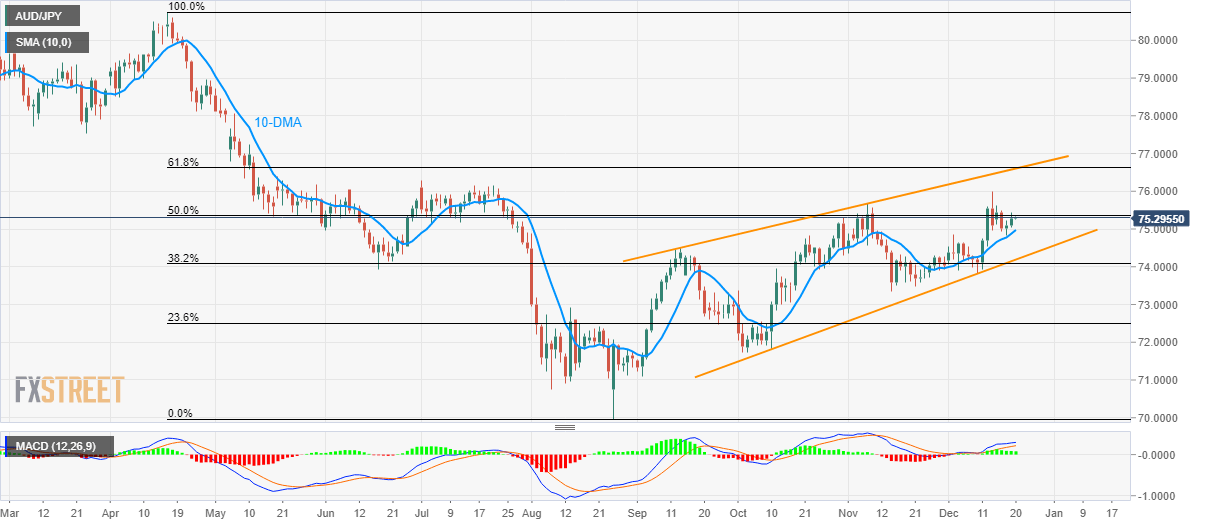
While holding its U-turn from 10-Day Simple Moving Average (DMA), AUD/JPY takes the bids to 75.30 during early Friday morning in Asia.
The pair nears 50% Fibonacci retracement of its fall between April and August, at 75.35, a break of which could escalate the rise to the monthly top surrounding 76.00.
During the quote’s additional upside beyond 76.00, multiple tops marked in May around 76.40 will return to the chart. Though, a confluence of a three-month-old rising wedge’s resistance line and 61.8% Fibonacci retracement around 76.60/65 will restrict the pair’s further advances beyond 76.40.
On the downside, the 10-DMA level of 74.97 can restrict the pair’s near-term declines ahead of highlighting the formation support of 74.18.
In a case where prices drop below 74.18 on a daily closing basis, 38.2% Fibonacci retracement near 74.08 and 74.00 round-figure can question bears targeting October month lows near 71.70 and the yearly bottom near 70.00.
AUD/JPY daily chart
Trend: Pullback expected