Back
27 Mar 2020
WTI Price Analysis: Pressured below $25.00, weekly trendline, 200-HMA in focus
- WTI remains on the back foot below short-term key resistances.
- Sellers await a clear break below 61.8% Fibonacci retracement, Wednesday’s top adds to resistance.
- A gradual weakness in prices, also portrayed by RSI, keeps sellers hopeful.
WTI declines to $24.12, down 0.20%, amid the Asian session on Friday. The oil benchmark remains below a short-term falling trend line from March 20 as well as 200-HMA.
In addition to the black gold’s sustained trading below key technical indicators, weak RSI conditions also favor the sellers.
However, 61.8% Fibonacci retracement of March18-20 upside, at $23.65, could offer immediate support ahead of driving the oil prices down to $22.20 and $21.00.
On the upside, the aforementioned resistance line, at $24.80, followed by a 200-HMA level of $25.35, can keep challenging the short-term buyers.
Further, the week’s top near $25.85 acts as an additional upside barrier during the quote’s break beyond $25.35.
WTI hourly chart
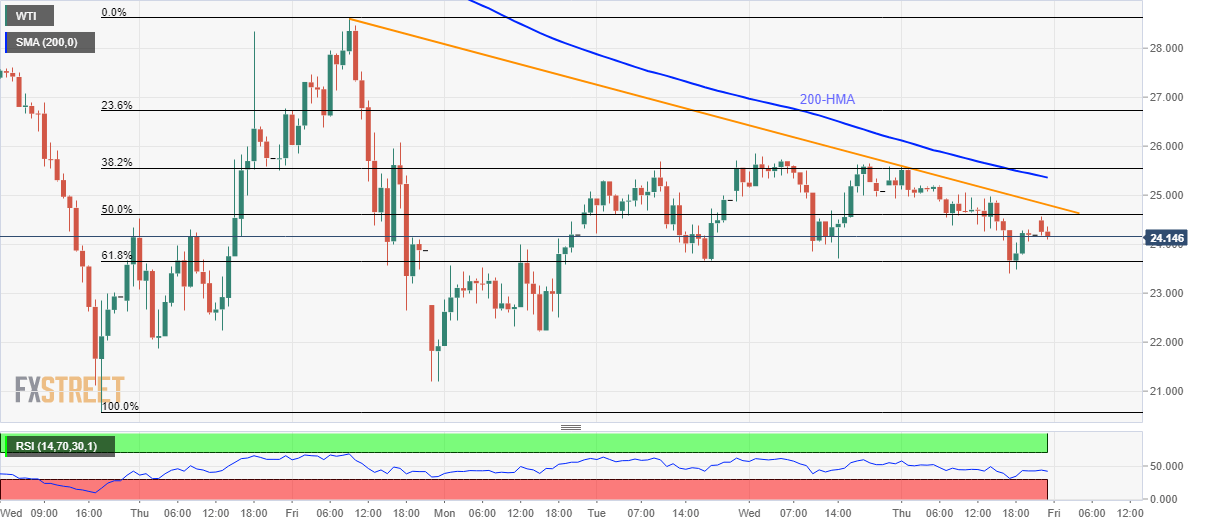
Trend: Bearish