Silver could be heading lower after breaking the channel on the daily chart
- Silver is trading over half a percent higher on the session on Tuesday but recently turned lower.
- The price has broken through USD 17.50 per troy ounce again to the downside in recent trade.
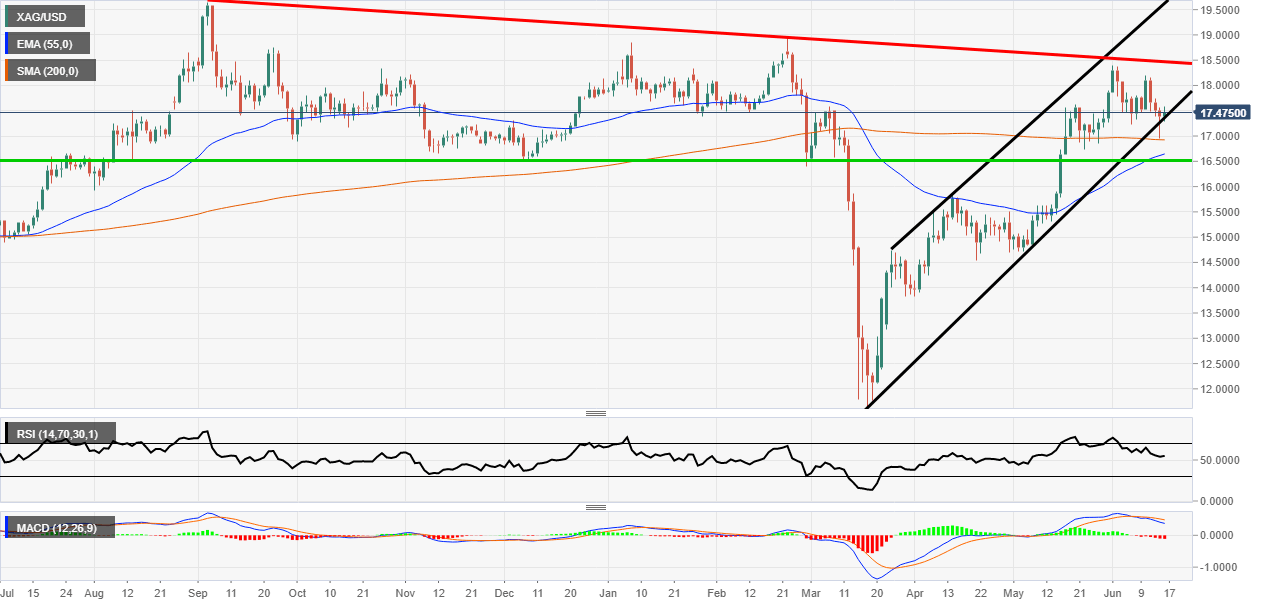
Silver daily chart
Although silver is trading higher on Tuesday the price broke below an important channel on Monday. The price then quickly moved back up after hitting USD 17 per troy ounce support and 200 Simple Moving Average.
If the price is to move lower from here then it would need to break the 200 and 55 moving averages to get to the green support level at USD 16.53 per troy ounce. The price also looks like it is forming a topping pattern with the waves making a lower high lower low pattern.
The Relative Strength Index indicator has moved away from the overbought zone and looks to be headed toward the 50 mid-line. The MACD histogram has also turned red but the signal lines are still above the mid-point. However, they have had a bearish cross and are pointing lower which adds to the bearish theory.
Additional levels