WTI Price Analysis: Clings to 200-bar SMA around $40.00 in Asia
- WTI struggles to extend recovery moves from $39.48.
- Falling trend line from September 04 also challenges the oil bulls.
- Five-week-old horizontal support will lure bears below the $39.00 threshold.
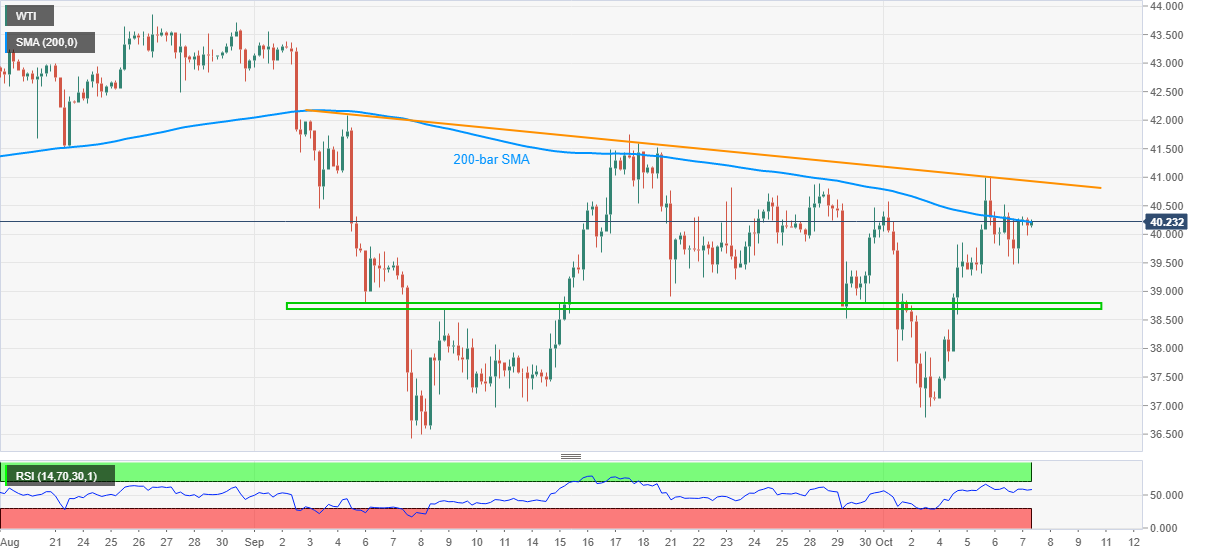
WTI picks up bids near $40.23 while heading into Thursday’s European session. In doing so, the black gold confronts 200-bar SMA after its positive performance on Wednesday.
While normal RSI conditions and risk-on mood favors the commodity to cross the immediate upside hurdle near $40.25, it’s further advances will be tamed by a falling trend line from the early September, currently around $40.95.
During the quote’s break past-$40.95, the $41.00 round-figure and September 18 top close to $41.45 can entertain the oil buyers.
On the contrary, a downside break of yesterday’s low of $39.48 can quickly direct WTI sellers toward a horizontal region between $38.70 and $38.80 that comprises multiple technical levels since September 04.
Also acting as the key support will be the monthly low of $36.79 and the September month’s bottom surrounding $36.40.
WTI four-hour chart

Trend: Further recovery expected
