NZD/USD Price Analysis: Teasing a descending triangle breakout on the 1H chart
- NZD/USD eyeing a descending triangle breakout on the 1H chart.
- Bullish RSI and crossover add credence to a potential move higher.
- Bulls look to test the April 20 high at 0.7230 and beyond.
NZD/USD is struggling to extend Wednesday’s gains above 0.7200, despite broad US dollar weakness and falling Treasury yields.
From a technical perspective, however, the kiwi remains poised for a further upside, as it is on the verge of breaking higher from a descending triangle spotted on the hourly chart.
An hourly candlestick close is needed above the 0.7215 triangle resistance to validate the pattern and fuel a quick uptick towards the April 20 high of 0.7230.
Further up, the psychological 0.7250 barrier will get challenged.
The additional upside bias is back by the Relative Strength Index (RSI), which holds firmer above the midline while a bull crossover also adds credence to a potential move higher.
Note that the 21-hourly moving average (HMA) pierced through the 50-HMA from below earlier today, charting a bullish crossover.
Note that that spot is trading within a descending triangle formation since mid-March.
NZD/USD hourly chart
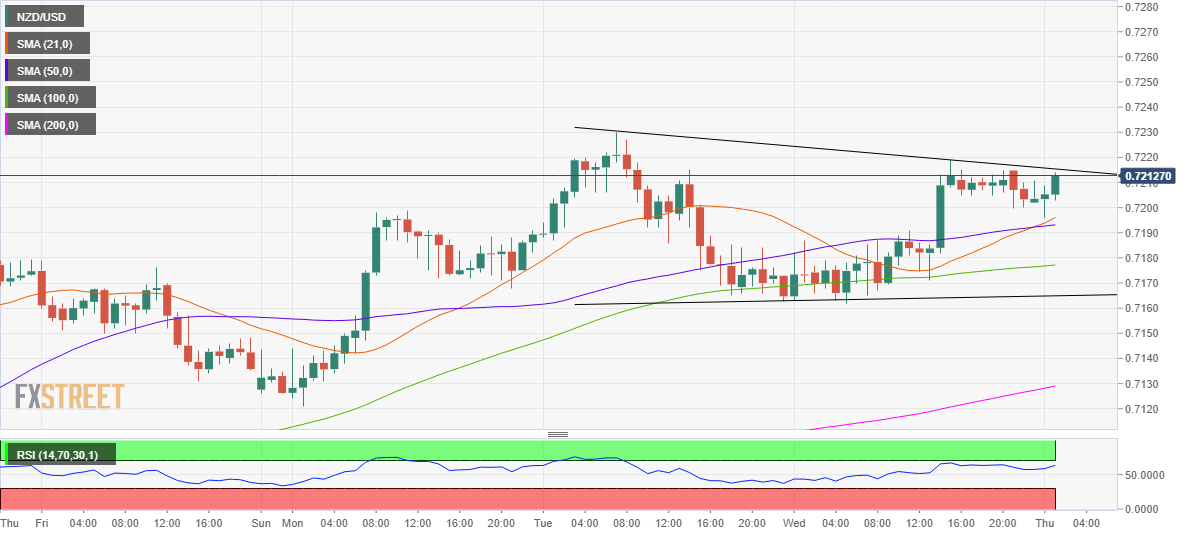
Alternatively, immediate support is aligned at the upward-pointing 21-HMA at 0.7196, below which the horizontal 100-HMA support at 0.7177 could be in focus.
The last line of defense for the NZD bulls is seen at the triangle support of 0.7165.
NZD/USD additional levels to watch