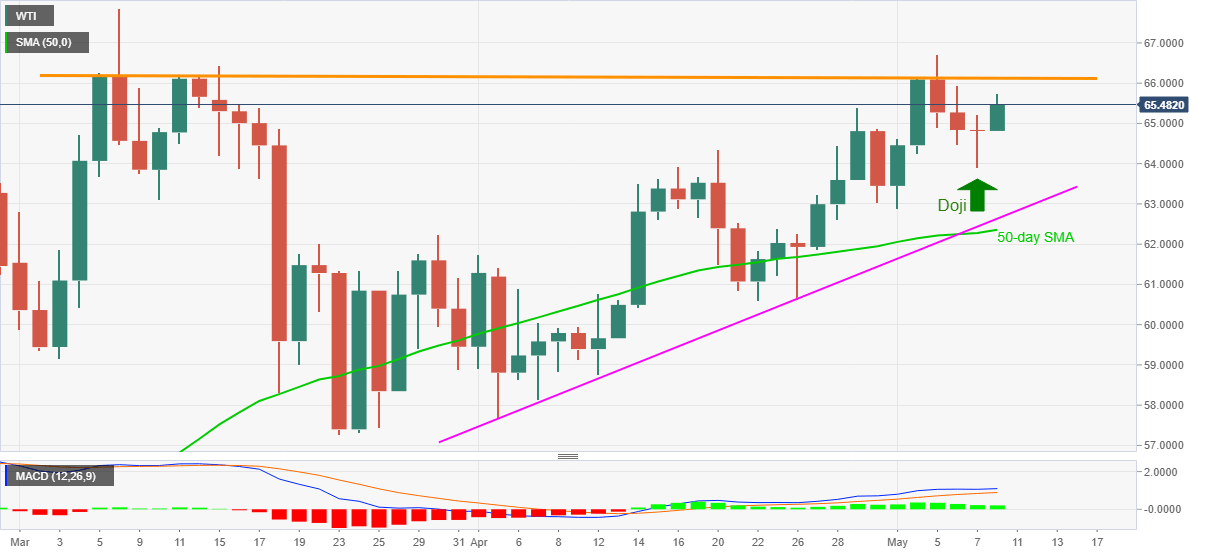
WTI Price Analysis: Looks set to revisit $66.20-30 resistance on Friday’s bullish Doji
- WTI picks up bids, rises the most in four days.
- Bullish candlestick, upbeat MACD direct traders to the key hurdle.
- Monthly support line, 50-day SMA restrict short-term downside.
WTI remains on the front foot, up 0.89% intraday near $65.40, as traders in Brussels brace for Monday’s bell. In doing so, the oil benchmark justifies Friday’s bullish Doji candlestick as well as upbeat MACD signals.
Although the latest run-up is set for cross the $66.00 round figure resistance, a horizontal area comprising multiple tops marked since early March around $66.20-30 will be a tough nut to crack for the oil bulls.
Should the barrel of black gold costs more than $66.30, the yearly high surrounding $67.85 will return to the chart.
During the pullback, $64.00 may entertain the short-term WTI sellers ahead of directing them to an ascending support line from April 05, near $62.60.
However, any further weakness past-$62.60 will be tested by a 50-day SMA level of $62.35, if not then the odds of the commodity’s gradual declines to $60.00 psychological magnet can’t be ruled out.
WTI daily chart

Trend: Bullish
