USD/JPY Price Analysis: Drops towards critical 21-DMA amid weaker Treasury yields
- USD/JPY is back in the red after reaching eight-day tops on Monday.
- Bears look to challenge critical 21-DMA support at 113.43.
- RSI has turned south, backing the latest downtick in the pair.
USD/JPY is posting moderate losses so far this Tuesday, having faced rejection once above the 114.00 level.
The spot snapped its two-day uptrend, correcting sharply from eight-day highs of 114.44, as the US Treasury yields resume their recent downside heading into the critical Fed decision. The weakness in the US dollar amid repositioning also exacerbates the pain in the major.
Looking at USD/JPY’s daily chart, the price is extending the decline to test the upward-sloping 21-Daily Moving Average (DMA) at 113.43.
If the bearish momentum accelerates, then the short-term trendline support at 113.28 could be probed.
A sharp sell-off below the latter cannot be ruled out, exposing the 113.00 threshold.
USD/JPY: Daily chart
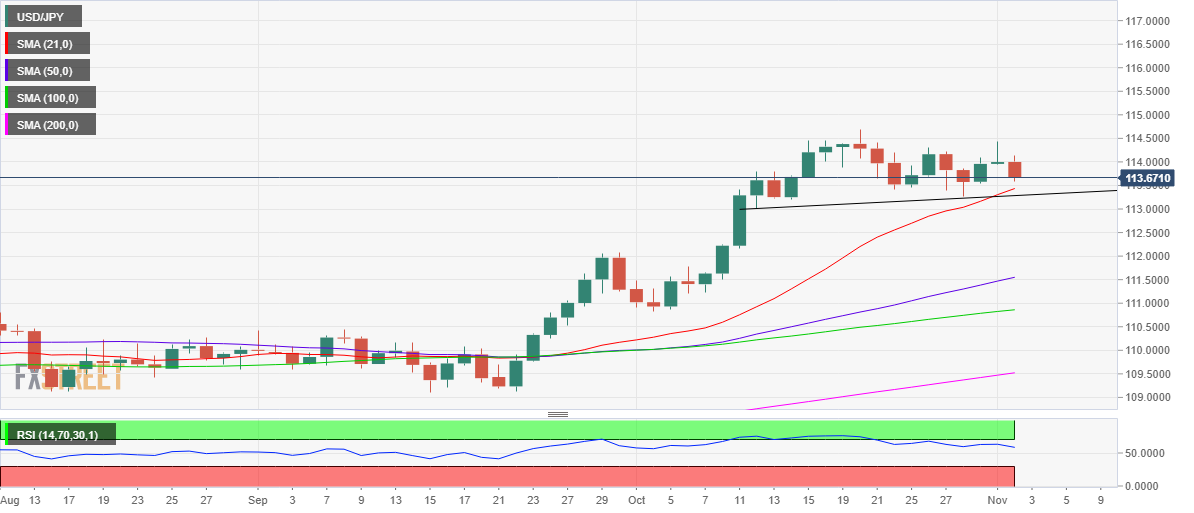
With the 14-day Relative Strength Index (RSI), however, still holding above the midline, the downside is likely to remain limited.
Acceptance above the weekly tops could call for a fresh advance towards the Oct 20 highs of 114.70.
Further up, the 115.00 psychological level will then challenge the bearish commitments.
USD/JPY: Additional levels to consider