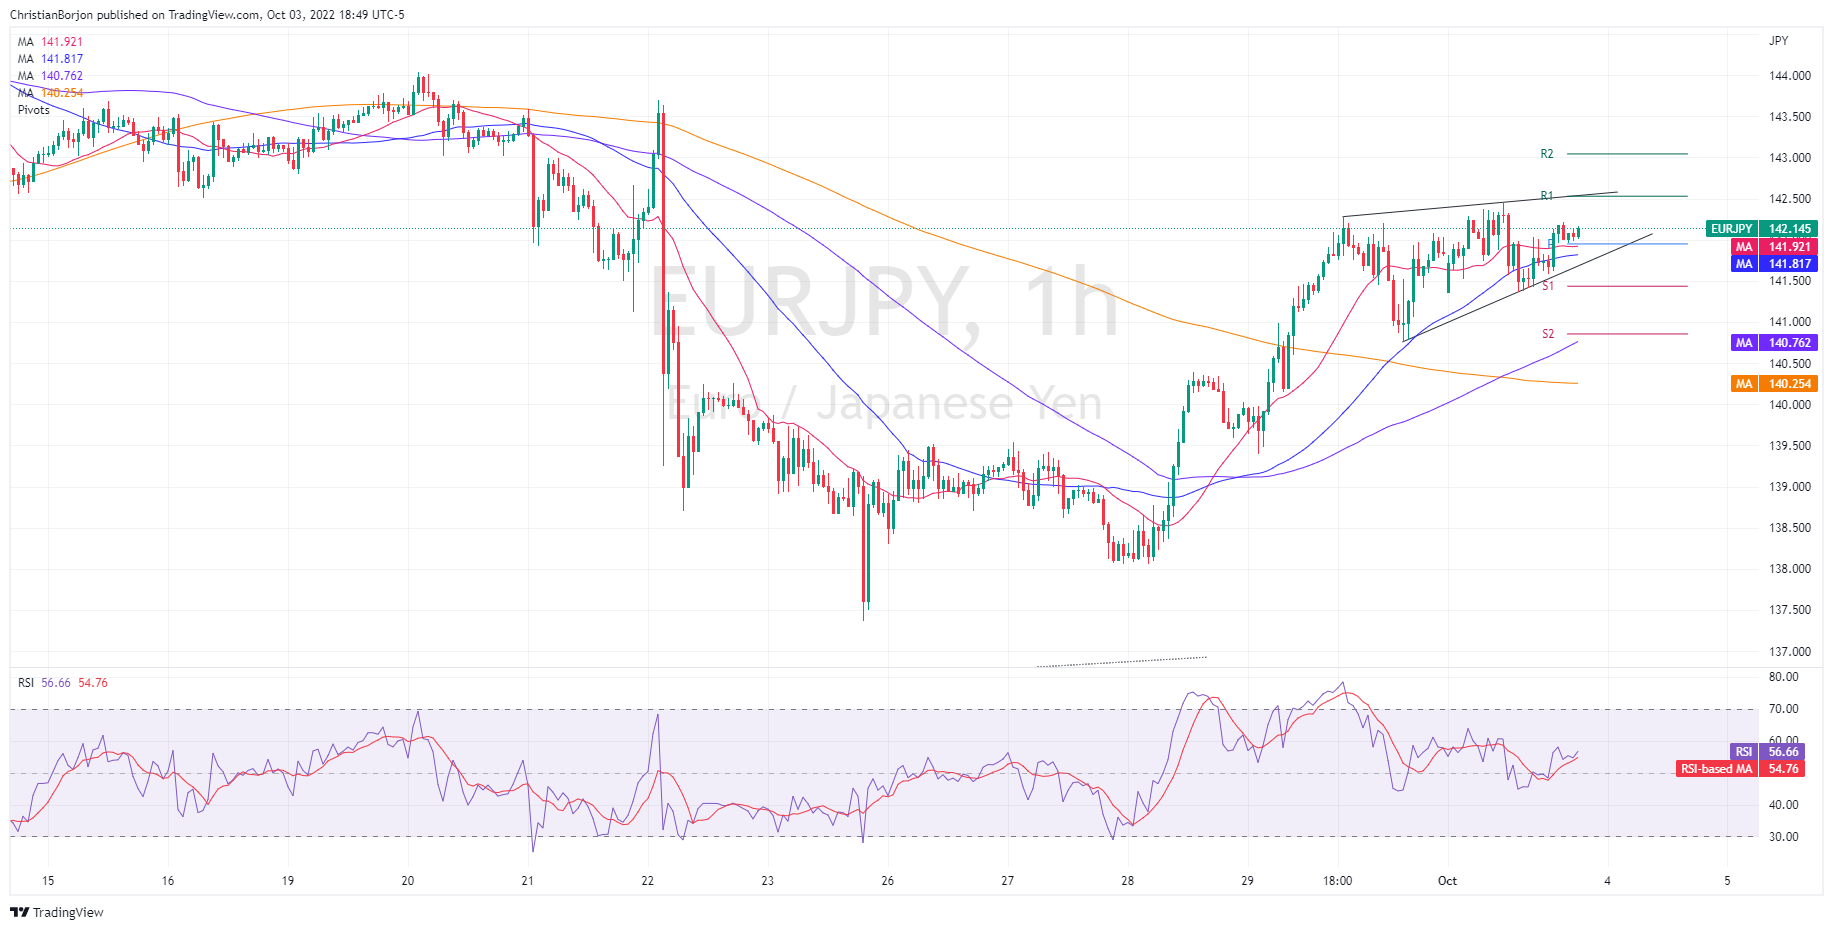
EUR/JPY Price Analysis: Faces solid resistance at 142.50, as a rising wedge emerges
- EUR/JPY rises and reclaims the 142.00 area, courtesy of improving market sentiment.
- Decelerating US economic data and UK’s tax cuts U-turn tempered investors’ fears, spurring a rally in global equities.
- Near term, the EUR/JPY is downward biased, and it could aim towards 140.80 if it clears 142.00.
The EUR/JPY climbs towards the 20-day EMA as the Asian session gets underway, up by a minimal 0.02%, as appetite for riskier assets augmented, courtesy of traders’ expectations for a less aggressive Fed, following the release of US economic data, suggesting economy activity slowed. Also, UK’s tax cut budget has been put aside by the Chancellor of the Exchequer, Kwasi Kuarteng, as it triggered market turmoil. At the time of writing, the EUR/JPY is trading at 142.14.
EUR/JPY Price Analysis: Technical outlook
From a daily chart perspective, the EUR/JPY is still neutral-to-upward biased, unable to crack above the 20-day EMA, located at 142.12. Even though the pair pierced the 20-day EMA, price action needs to get higher and break the YTD high at 145.63 to pave the way for further gains and shift the bias upwards. Nevertheless, the Relative Strength Index (RSI), even though it persists in positive territory, is almost flat, suggesting that the price is consolidating.
The EUR/JPY hourly chart depicts the formation of an ascending wedge, which usually is a bearish-biased chart pattern. Nevertheless, it should be noted that the EMAs reside below the spot price, so there would be some difficult hurdles to surpass on the way south.
Therefore, the EUR/JPY first support would be the 20-EMA at 141.92, followed by the 50-EME at 141.81, ahead of the bottom trendline of the wedge, around 141.70. Once cleared, the next support would be the S1 daily pivot point at 141.45, followed by the confluence of the S2 pivot and the 100-EMA at 140.80.

EUR/JPY Key Technical Levels
